Loading...
Beginner to intermediate2 daysMost popularHRD Corp claimable
Microsoft Power BI: Data Analysis, Dashboarding and Reporting Automation
From scattered spreadsheets to a Power BI dashboard your management trusts, in 2 days.
Clean data with Power Query, build KPIs with DAX (the formula language behind Power BI measures) and publish to Power BI Service.
Programme overview
A structured, hands-on route to practical Power BI reporting capability for teams who want clearer dashboards and more confident data-driven decisions.
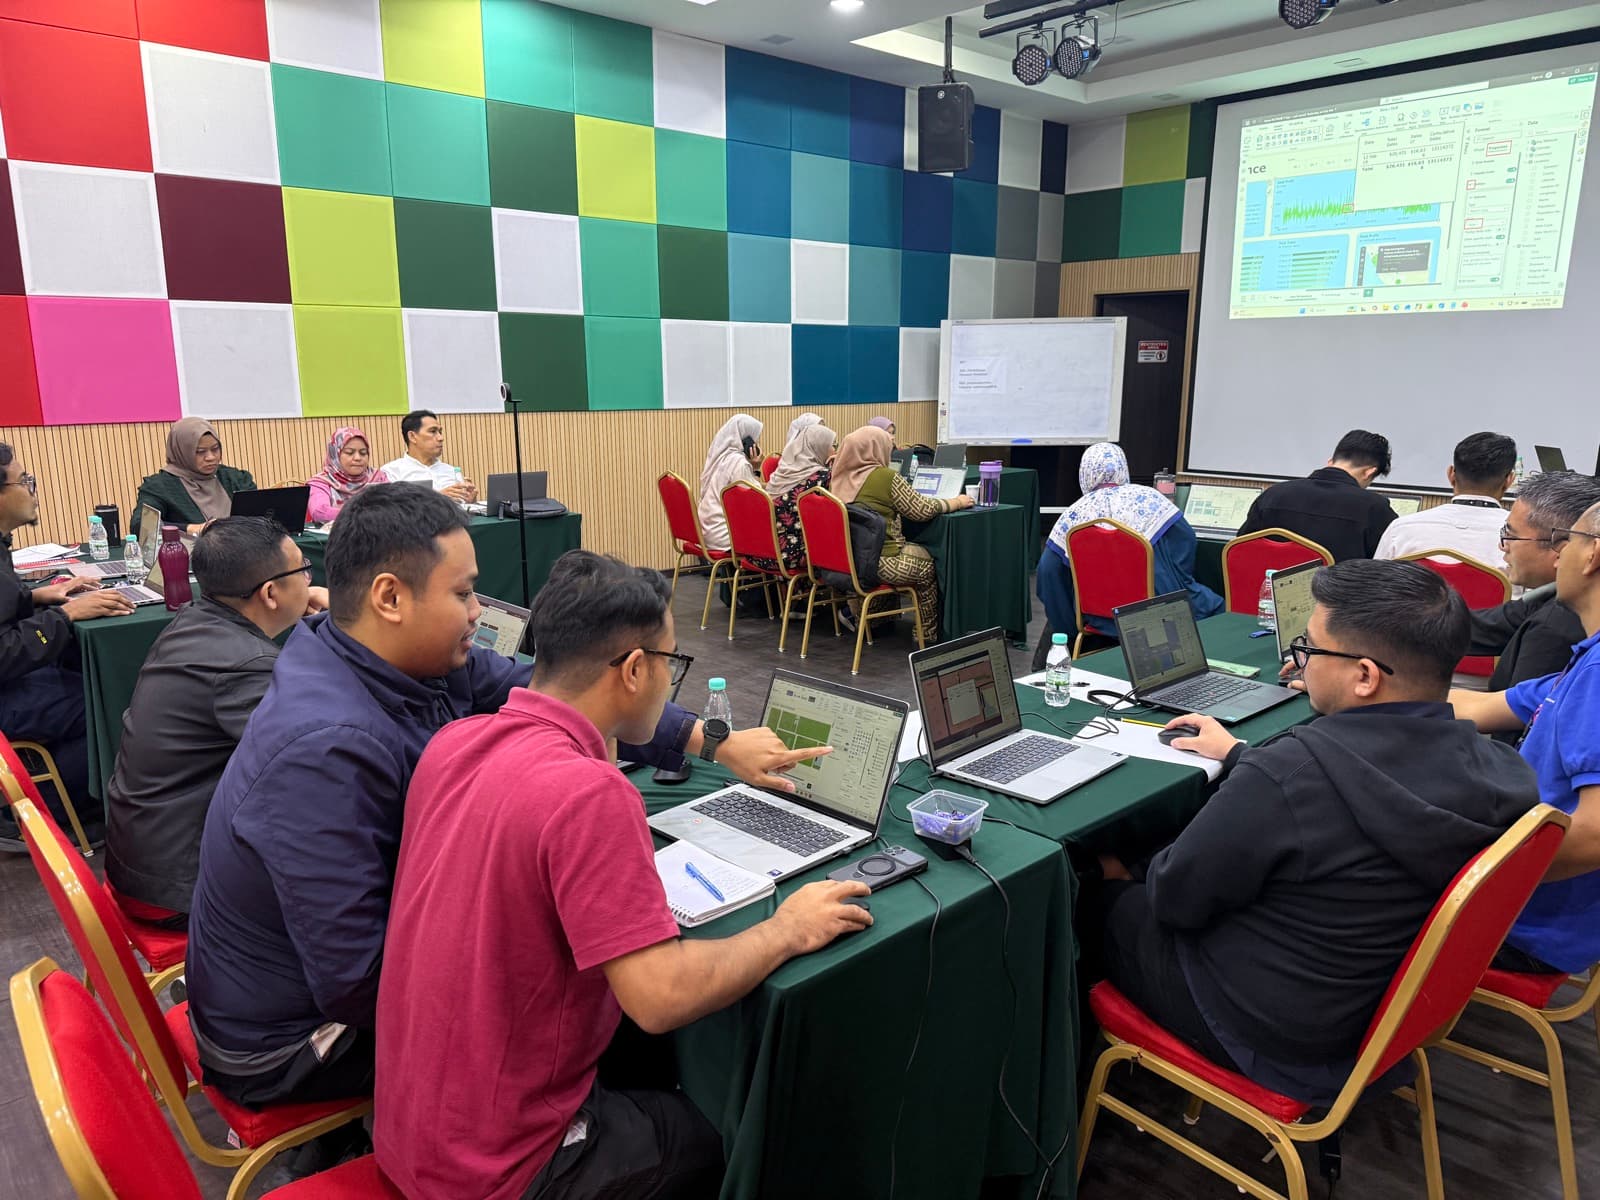
Participants work through the full reporting workflow: data connection and transformation, modelling, DAX, dashboard development and sharing in Power BI Service. Guided exercises use realistic business data, so the same method carries straight into their own reports.
What your team will learn
- Connect and consolidate business data from Excel, CSV, folders and related sources.
- Clean, transform and prepare repeatable datasets with Power Query.
- Build data models, relationships, DAX measures and time-intelligence logic.
- Design interactive dashboards, then publish and share them through Power BI Service.
Who should join
- Executives and managers who need clearer reporting visibility
- Business and data analysts producing recurring reports
- Finance, HR, sales, marketing, procurement and operations teams
- Engineers and technical staff supporting operational reporting
Prerequisites
- Basic Microsoft Excel familiarity
- General experience working with business data
- A laptop with Power BI Desktop installed (setup steps are sent before the session)
Programme modules
- Module 1Power BI orientation and reporting workflow
- Desktop, Service and Mobile
- The Connect, Build, Design workflow
- Where AI fits in reporting
- Module 2Power BI Desktop setup and data import
- Importing Excel and CSV
- Combining a folder of files
- Checking data quality
- Module 3Power Query foundations
- Applied steps
- Data types and clean-up
- Repeatable transformations
- Module 4Advanced transformation and data modelling
- Merge, append and unpivot
- Star schema
- Relationships and filter flow
- Module 5DAX foundations for business reporting
- Measures versus columns
- SUM, DIVIDE and CALCULATE
- Checking business logic
- Module 6DAX calculations and time intelligence
- Year-to-date and prior year
- Growth and variance
- Date tables
- Module 7Dashboard design and interactive navigation
- Visual hierarchy
- Filters and slicers
- Page navigation and drill-through
- Module 8Guided dashboard build
- Building a management dashboard
- Layout and storytelling
- Review against business questions
- Module 9Power BI Service, publishing and governance
- Workspaces and sharing
- Scheduled refresh
- Security basics
- Module 10Capstone review and Q&A
- Dashboard review
- Adoption at work
- Next steps
What participants say
“One of the biggest takeaways from this workshop is that effective analytics goes beyond creating dashboards.”
Aliya Zarena ZainulanuarPower BI workshop participant
“The session sharpened and strengthened my understanding of how Power BI can transform raw data into meaningful insights through dashboards, visualisations, and data-driven reporting.”
Nufail IsmailPower BI Mastery webinar participant
“Looking forward to applying what I’ve learned in data analysis, reporting, and data-driven decision-making.”
Siti Nabihah Abdul HamidPower BI Mastery webinar participant
Meet your lead trainer

Hariz SharifFounder, Digital Analytic Solution
Hariz has 8+ years in the energy, utilities and engineering sectors and leads Power BI work for operations and maintenance at a multinational oil and gas operator. He is Microsoft PL-300 certified, an HRD Corp accredited trainer and a Professional Technologist (Ts.), and has trained more than 3,000 learners since 2024.
Trainers are assigned per programme. Not every trainer attends every session.
Frequently asked questions
Can the programme run at our office?
Yes. We can deliver at your premises, at a training venue or virtually over Zoom or Microsoft Teams.
Is the programme HRD Corp claimable?
We are an HRD Corp registered training provider. Eligible programmes can be claimed, and we provide the documents your HR team needs for the application.
Can you customise the content for our team?
Yes. We adjust the examples, exercises and level to your industry and data. We can also combine topics from several programmes.
Will participants receive a certificate?
Yes. Participants who complete the programme receive a certificate of completion.
How many participants can join?
Share your group size when you request a proposal. We will recommend the right format and trainer support so everyone gets hands-on help.
Recommended reading
Get a head start.

 Power BIGetting Started with Power BI
 Hariz SharifTutorial
Getting Started with Power BI: Your First Dashboard in Under an Hour
Read articleDAXIntroduction to DAX for Power BIHariz SharifTutorialIntroduction to DAX for Power BI: Formulas That Transform Your Reports
Read articleDashboard designDashboard Design PrinciplesHariz SharifIndustry InsightsDashboard Design Principles: Build Power BI Reports People Actually Use
Read articleRelated programmes
Build on this programme.

 1 day
1 dayPower BI for Automated Reporting: Turn Excel Reports into Interactive Dashboards
Rebuild a manual Excel report in Power BI, so it refreshes itself.
6 modules · 1 dayView programme

 1 day
1 dayExcel for Data Analysis and Reporting: From Raw Data to Management Dashboard
A clean, reliable Excel report and a dashboard template you reuse every month.
6 modules · 1 dayView programme
Let’s work together
Plan Microsoft Power BI for your team.
Share your team size, level and preferred dates. We will recommend a format and send a proposal.