Loading...
Intermediate1 dayHRD Corp claimable
Power BI for Automated Reporting: Turn Excel Reports into Interactive Dashboards
Still rebuilding the same Excel report every Monday?
Build your report once in Power BI. Let it refresh itself.
Turn a manual Excel report into an automated Power BI dashboard with Power Query and scheduled refresh.
Programme overview
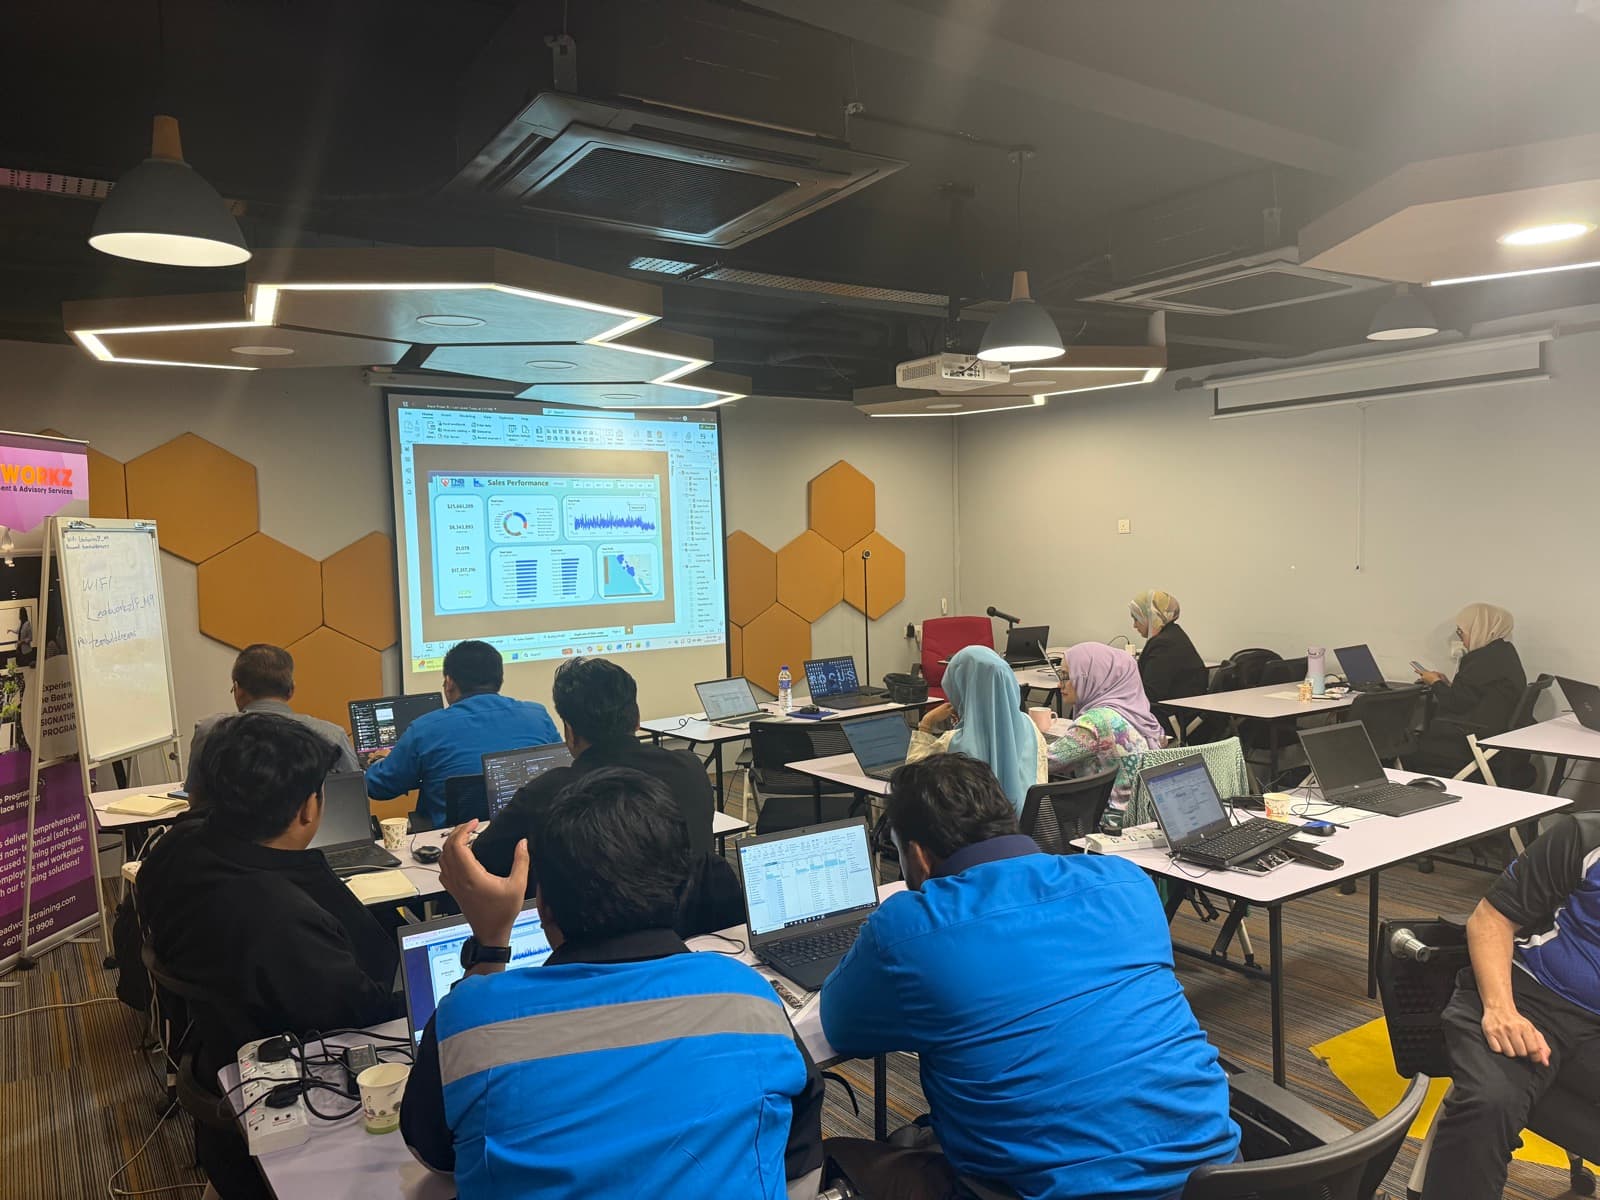
The day starts with a typical monthly Excel report and a simple question: what if next month’s update took one click? Participants rebuild the same report in Power BI and see the difference for themselves.
They combine monthly files with Power Query, build a proper data model, write DAX measures for the KPIs and design a dashboard managers can filter and drill into. They leave with a reusable Power BI dashboard template, published and set to refresh.
What your team will learn
- Explain when to use Power BI instead of Excel, using a real before-and-after comparison.
- Combine and clean Excel and CSV files with repeatable Power Query steps.
- Build a star-schema model and DAX measures for revenue, growth and year-to-date.
- Design, publish and refresh an interactive dashboard, saved as a reusable template.
Who should join
- Excel users who spend hours each month updating the same reports
- Analysts and executives who present KPIs to management
- Finance, HR, sales, procurement and operations teams
Prerequisites
- Comfortable with Excel tables, formulas and PivotTables
- A Windows laptop with Power BI Desktop installed
Programme modules
- Module 1Why Power BI: from Excel report to data model
- Before-and-after comparison
- What changes in the workflow
- Module 2Connecting and combining data
- Excel and CSV files
- Combining monthly files
- Repeatable clean-up
- Module 3Data modelling
- Fact and dimension tables
- Relationships
- Date table
- Module 4DAX measures for KPIs
- Revenue and margin
- Growth
- Year-to-date
- Module 5Building a reusable dashboard template
- KPI cards and charts
- Slicers and drill-down
- Saving as a template
- Module 6Publishing, sharing and refresh
- Publishing to Power BI Service
- Sharing
- Scheduled refresh
Meet your lead trainer

Hariz SharifFounder, Digital Analytic Solution
Hariz has 8+ years in the energy, utilities and engineering sectors and leads Power BI work for operations and maintenance at a multinational oil and gas operator. He is Microsoft PL-300 certified, an HRD Corp accredited trainer and a Professional Technologist (Ts.), and has trained more than 3,000 learners since 2024.
Trainers are assigned per programme. Not every trainer attends every session.
Frequently asked questions
Can the programme run at our office?
Yes. We can deliver at your premises, at a training venue or virtually over Zoom or Microsoft Teams.
Is the programme HRD Corp claimable?
We are an HRD Corp registered training provider. Eligible programmes can be claimed, and we provide the documents your HR team needs for the application.
Can you customise the content for our team?
Yes. We adjust the examples, exercises and level to your industry and data. We can also combine topics from several programmes.
Will participants receive a certificate?
Yes. Participants who complete the programme receive a certificate of completion.
How many participants can join?
Share your group size when you request a proposal. We will recommend the right format and trainer support so everyone gets hands-on help.
Recommended reading
Get a head start.

 Power Query
 Hariz SharifTutorial
Related programmes
Build on this programme.

 2 daysMost popular
Microsoft Power BI: Data Analysis, Dashboarding and Reporting Automation
The complete reporting workflow, from data connection to a published dashboard.
10 modules · 2 daysView programme

 1 day
1 dayExcel for Data Analysis and Reporting: From Raw Data to Management Dashboard
A clean, reliable Excel report and a dashboard template you reuse every month.
6 modules · 1 dayView programme
Let’s work together
Plan Power BI for Automated Reporting for your team.
Share your team size, level and preferred dates. We will recommend a format and send a proposal.