
Introduction to Power Query: Clean and Transform Data Like a Pro
Every data professional knows the truth: 80% of your time goes into cleaning data, and 20% goes into analysing it. Power Query exists to flip that ratio.
Power Query is the data transformation engine built into Power BI (and Excel). It lets you connect to data sources, clean messy data, reshape tables, merge datasets, and automate the entire process so it runs with a single click every time your data updates.
If you have ever spent hours manually fixing dates, removing blank rows, splitting columns, or matching data across spreadsheets, Power Query will change how you work.
What is Power Query?
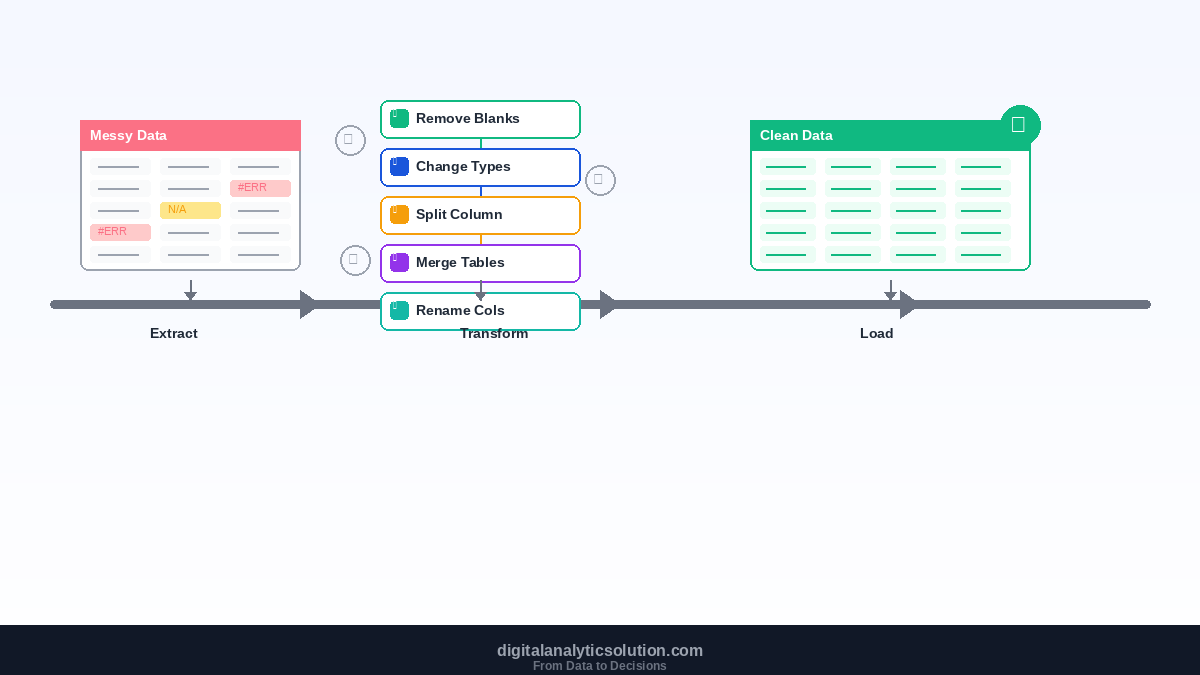
Power Query is a graphical ETL (Extract, Transform, Load) tool. You tell it what to do with your data through a point-and-click interface, and it records every step as a reproducible transformation pipeline.
Behind the scenes, Power Query uses a language called M (also known as Power Query Formula Language). You do not need to learn M to use Power Query effectively, as the graphical interface generates M code automatically. But knowing it exists means you can hand-edit steps when needed.
Where you find Power Query:
Power BI Desktop: click Transform Data on the Home ribbon
Excel: go to Data > Get & Transform Data
Power Automate (Dataflows): cloud-based Power Query for automated data pipelines
Why Power Query Matters
Without Power Query, you are stuck in a loop:
Download the raw data
Open it in Excel
Manually delete header rows, fix dates, remove blanks
Copy the cleaned data into your report
Repeat everything next week when new data arrives
With Power Query, you set up the cleaning steps once. Every time you click Refresh, Power Query pulls fresh data and applies all your transformations automatically. No manual work. No missed steps. No errors from copy-pasting.
Getting Started: The Power Query Editor
In Power BI Desktop, click Transform Data to open the Power Query Editor. The interface has four key areas:
Queries pane (left): lists all your data sources and queries
Preview pane (centre): shows a preview of your data with current transformations applied
Applied Steps (right): lists every transformation step, in order, that you have applied
Ribbon (top): contains all transformation tools organised by category
The Applied Steps panel is the heart of Power Query. Every action you take appears as a named step. You can click on any step to see the data at that point. You can delete, reorder, or edit steps at any time.
Essential Power Query Transformations
Let us walk through the transformations you will use most often.
1. Remove Unnecessary Rows
Real data files often have title rows, blank rows, or summary rows at the bottom that do not belong in your dataset.
Remove top rows: Home > Remove Rows > Remove Top Rows. Enter the number of non-data rows at the top.
Remove blank rows: Home > Remove Rows > Remove Blank Rows. Instantly cleans up empty lines.
Use first row as headers: Home > Use First Row as Headers. Promotes the first data row to column names.
2. Change Data Types
Power Query guesses data types when you import, but it does not always get it right. A column of dates might import as text. A column of numbers might come in as text because of one errant entry.
Click the data type icon next to any column header to change it. Common types:
Whole Number: for counts and IDs
Decimal Number: for financial values and measurements
Date: for date columns (not Date/Time unless you need time precision)
Text: for names, categories, and identifiers
Tip: Fix data types early in your transformation pipeline. Many downstream operations (sorting, filtering, calculations) behave differently depending on data type.
3. Split and Merge Columns
Split a column: Your data has "Full Name" but you need "First Name" and "Last Name" separately. Right-click the column > Split Column > By Delimiter. Choose space as the delimiter.
Merge columns: You have "City" and "Country" but need a combined "Location" column. Select both columns (Ctrl+click), then right-click > Merge Columns. Choose a separator like a comma and space.
4. Replace Values
Inconsistent data is everywhere. "MY" and "Malaysia" and "MYS" all mean the same thing but Power BI treats them as three separate categories.
Right-click a column > Replace Values. Enter the value to find and the replacement. Repeat for each variation.
For bulk replacements, consider using a mapping table (covered in the Merge section below).
5. Add Calculated Columns
Power Query lets you create new columns based on existing data:
Column from Examples: Add Column > Column from Examples. Type what you want in a few rows and Power Query figures out the pattern. This is surprisingly powerful for extracting parts of text, reformatting dates, or combining fields.
Custom Column: Add Column > Custom Column. Write an M expression for more complex logic. For example:
if [Revenue] > 10000 then "High" else "Low"Conditional Column: Add Column > Conditional Column. A visual interface for if-then-else logic without writing code.
6. Pivot and Unpivot
Unpivot is one of Power Query's most valuable tools. Suppose your data has months as column headers (Jan, Feb, Mar, etc.) with values underneath. This is great for reading but terrible for analysis.
Select the columns to unpivot, right-click > Unpivot Columns. Power Query converts them into two columns: Attribute (the month names) and Value (the numbers). Now you can create proper time-series charts.
Pivot does the reverse: converts row values into column headers.
7. Merge Queries (VLOOKUP Replacement)
This is the feature that replaces VLOOKUP forever. Suppose you have a Sales table and a Products table. You want to add product category information to your sales data.
In Power Query, select your Sales query
Click Home > Merge Queries
Select the Products query as the second table
Click the matching column in both tables (e.g., Product ID)
Choose the join type (Left Outer is most common: keep all rows from Sales, match from Products)
Click OK
A new column appears with the merged table nested inside. Click the expand icon to choose which columns to bring in.
8. Append Queries
When you have multiple tables with the same structure (e.g., monthly sales files from January to December), use Append instead of Merge.
Home > Append Queries. Select the tables to stack on top of each other. Power Query combines them into a single table, matching columns by name.
A Real-World Example: Cleaning Sales Data
Let us put it all together. You receive a monthly Excel file from your sales team. The file has:
3 title rows at the top before the actual headers
Blank rows scattered throughout
Dates formatted as text ("15-Mar-2026")
Region codes instead of region names ("KL" instead of "Kuala Lumpur")
Revenue stored as text with currency symbols ("RM 12,500")
Here is your Power Query pipeline:
Remove Top Rows: Remove the first 3 rows
Use First Row as Headers: Promote the actual header row
Remove Blank Rows: Clean up empty lines
Change Date Type: Convert the Date column from text to Date
Replace Values: Map "KL" to "Kuala Lumpur", "PG" to "Penang", etc.
Clean Revenue: Replace "RM " with nothing, remove commas, change type to Decimal Number
Close & Apply: Load the clean data into your Power BI model
Total time: about 10 minutes. Next month, when you get the new file, just click Refresh. Every transformation runs again automatically.
Power Query Best Practices
Name your steps. Right-click any step in Applied Steps and rename it. "Changed Type" tells you nothing. "Set Date Column to Date Type" tells you everything.
Fix data types as the first step. Many transformations depend on correct types. Set them early to avoid downstream issues.
Remove columns you do not need. Every column you keep increases your model size. Right-click > Remove Other Columns to keep only what you need.
Do not hard-code values. If your source file path changes, use parameters instead of fixed paths. This makes your queries portable.
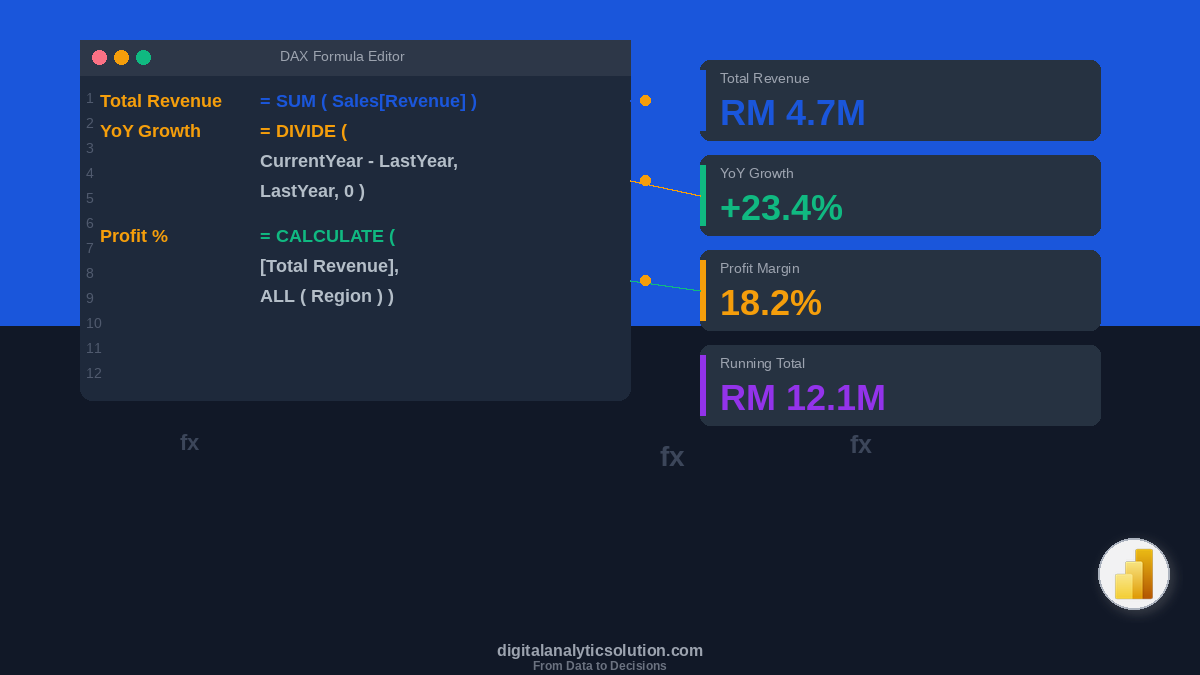
Keep transformations in Power Query, not DAX. If you can do it in Power Query, do it there. Power Query runs once during refresh. DAX calculations run every time you interact with a visual. Power Query is almost always more efficient.
What to Learn Next
Power Query is your data preparation foundation. From here, expand your skills:
Introduction to DAX: build calculated measures and columns that go beyond what Power Query can do
Dashboard Design Principles: design dashboards that make your clean data shine
Data Storytelling: present your insights in a way that drives action
Getting Started with Power BI: if you skipped the basics, start here
For automating your data collection pipeline before it reaches Power Query, explore building data pipelines with n8n or automating Google Workspace with n8n to feed clean data into your Power BI reports automatically.
Summary
Power Query transforms data preparation from a weekly chore into a one-time setup. Connect your data, define your cleaning steps, and let Power Query repeat the process every time you refresh. No more manual cleaning. No more copy-paste errors. No more wasted hours.
The best analysts are not the ones who spend the most time on data. They are the ones who automated the boring parts and spend their time on insights that matter.
This article is part of the Digital Analytics Solution content series. Explore the full series to build your skills in automation, AI-assisted development, and data analytics.