Loading...
About Digital Analytic Solution
Most trainers teach the tools. We use them at work first.
We teach the dashboards we build in real operations.
8+ years in energy and utilities, Microsoft PL-300 certified and 3,000+ learners trained. Our founder cut a KPI report from 3 days to 30 minutes with Power BI and Microsoft Fabric.

What we build and teach with
 Power BI
 Excel
Excel PowerPoint
 OneDrive
 SharePoint
 Power Apps
 Power Automate
 Copilot
 Google Sheets
 Google Drive
 n8n
n8n Supabase
 Lovable
 Claude
 ChatGPT
 Gemini
 Antigravity
 GitHub
 Python
 Looker Studio
/01 Our practice
The project and the classroom inform each other.
Client delivery keeps our training grounded in real business problems. Teaching keeps our delivery focused on clarity and the people who will take ownership.
Our mission is to equip professionals and organisations with industry-tested analytics skills they can apply in their working environment.
- Deliver client projects
Dashboards, automations, apps and AI workflows for real teams.
- Capture what works
Patterns, trade-offs and mistakes worth avoiding.
- Turn it into training
Exercises built from the same business scenarios.
- Build capable teams
People who can maintain and extend what was delivered.


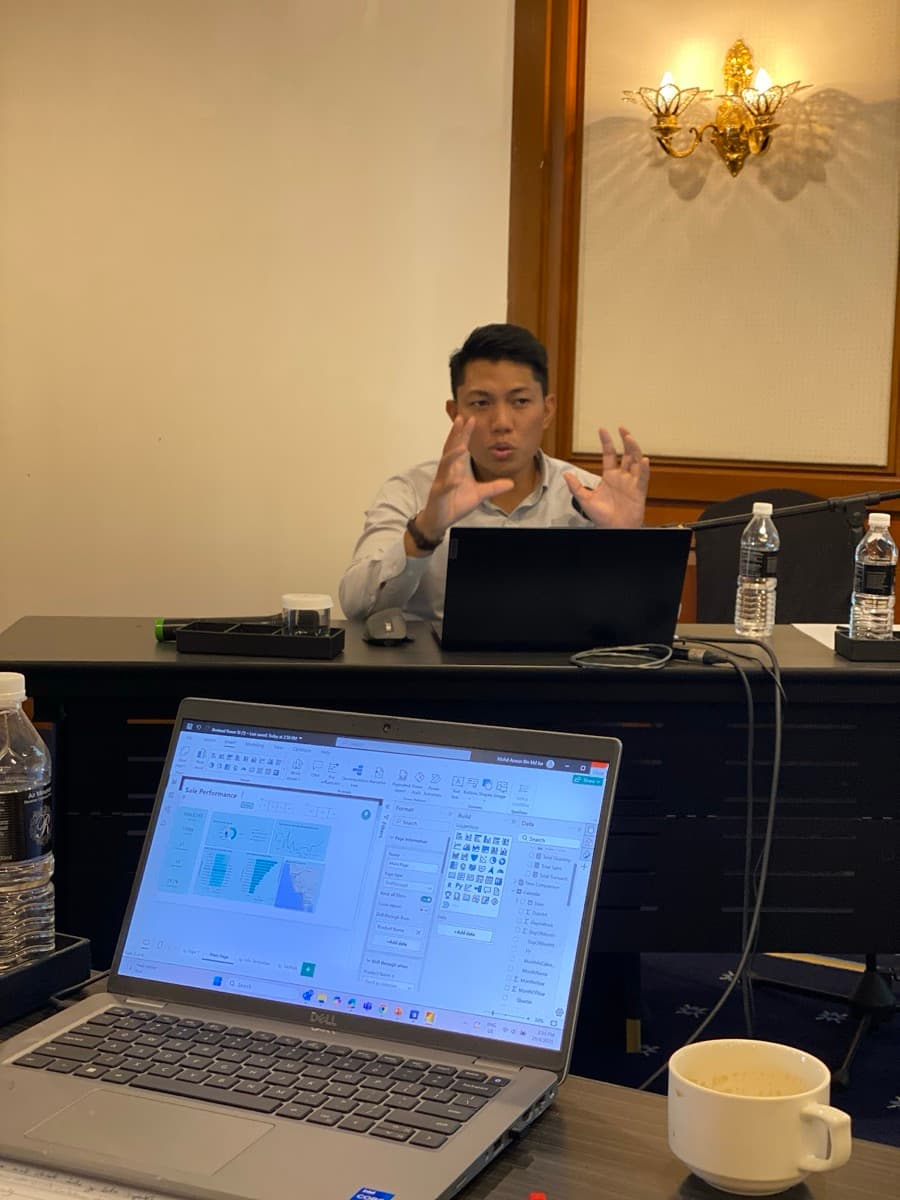
/02 Meet the founder
Technical depth. A trainer’s clarity.
Hariz is a Microsoft-certified Power BI Data Analyst whose career spans maintenance planning, engineering operations and business intelligence. He leads Power BI and Microsoft Fabric work for operations and maintenance at a multinational oil and gas joint operation, where his dashboards support equipment reliability, work order readiness and production monitoring.
He founded BelajarPowerBI.com and Digital Analytic Solution to bring that experience into the classroom. Participants learn not only how the tools work, but why each step matters in real operational and business settings.
- Microsoft PL-300Power BI Data Analyst Associate
- HRD CorpAccredited trainer
- Ts. (MBOT)Professional Technologist
- Graduate EngineerBoard of Engineers Malaysia (Electrical)
- First Class HonoursBachelor of Electrical Engineering (Power)
- BelajarPowerBI.comFounder
“Train Hard. Build Smart. Lift Everyone.”
- 3,000+Learners trained in public, in-house and online programmes
- 190+Training sessions delivered since May 2024
- 8+ yrsIndustry experience in energy, utilities and engineering
- 40%Fewer work order delays from his Power BI solutions
Career journey
From the plant floor to the dashboard.
- 2023 – presentFounder & Lead TrainerDigital Analytic Solution Sdn Bhd
- Public, in-house and online Power BI, Excel and AI training, plus Power BI consulting.
- 2023 – presentLead Power BI Developer & Consultant, Operations & MaintenanceMultinational oil and gas joint operation (MNC)
- Leads Power BI and Microsoft Fabric analytics across operations, maintenance and corporate reporting.
- Integrated SAP, SQL Server, Snowflake and SharePoint data with governed models and row-level security.
- Cut management KPI preparation from 3 days to 30 minutes.
- 2022 – 2023Maintenance Planner (Power Platform Developer)Energy utility (GLC)
- Built Power BI dashboards for maintenance KPIs and reliability tracking.
- Pioneered Power BI adoption through an internal innovation hackathon.
- 2018 – 2021Maintenance ExecutiveEnergy utility (GLC)
- Hands-on maintenance and operations experience that shapes his reporting examples today.
Practitioner impact
Results from his own Power BI work.
- 40%Fewer work order delaysIntegrated maintenance reliability tracking
- 75%Faster report turnaroundAutomated refresh and notification of management reports
- 148Wells monitored togetherWeekly wells health view, replacing one-by-one tracking
- 90%Shorter pipeline timeFabric bronze, silver and gold layers with Databricks and Snowflake
In the classroom
The people we work with.
Corporate teams, public seminars and community workshops across Malaysia.
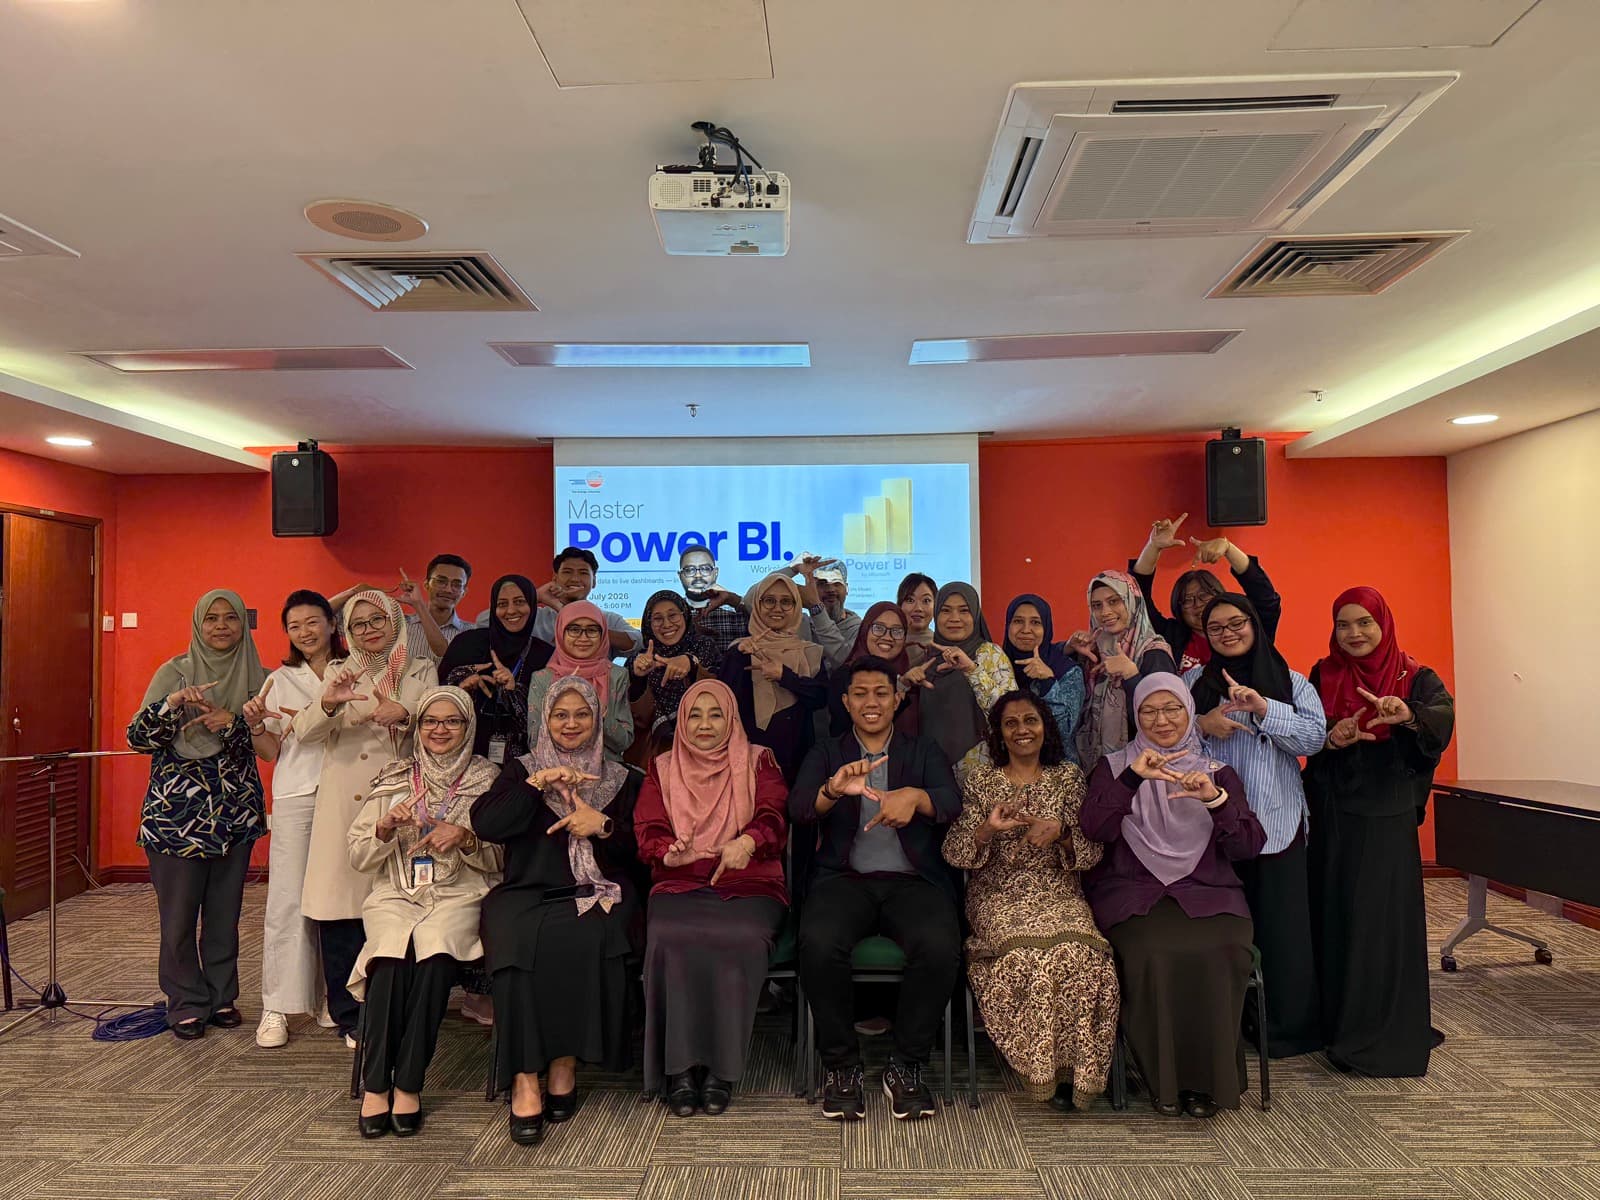 Power BI Mastery seminar
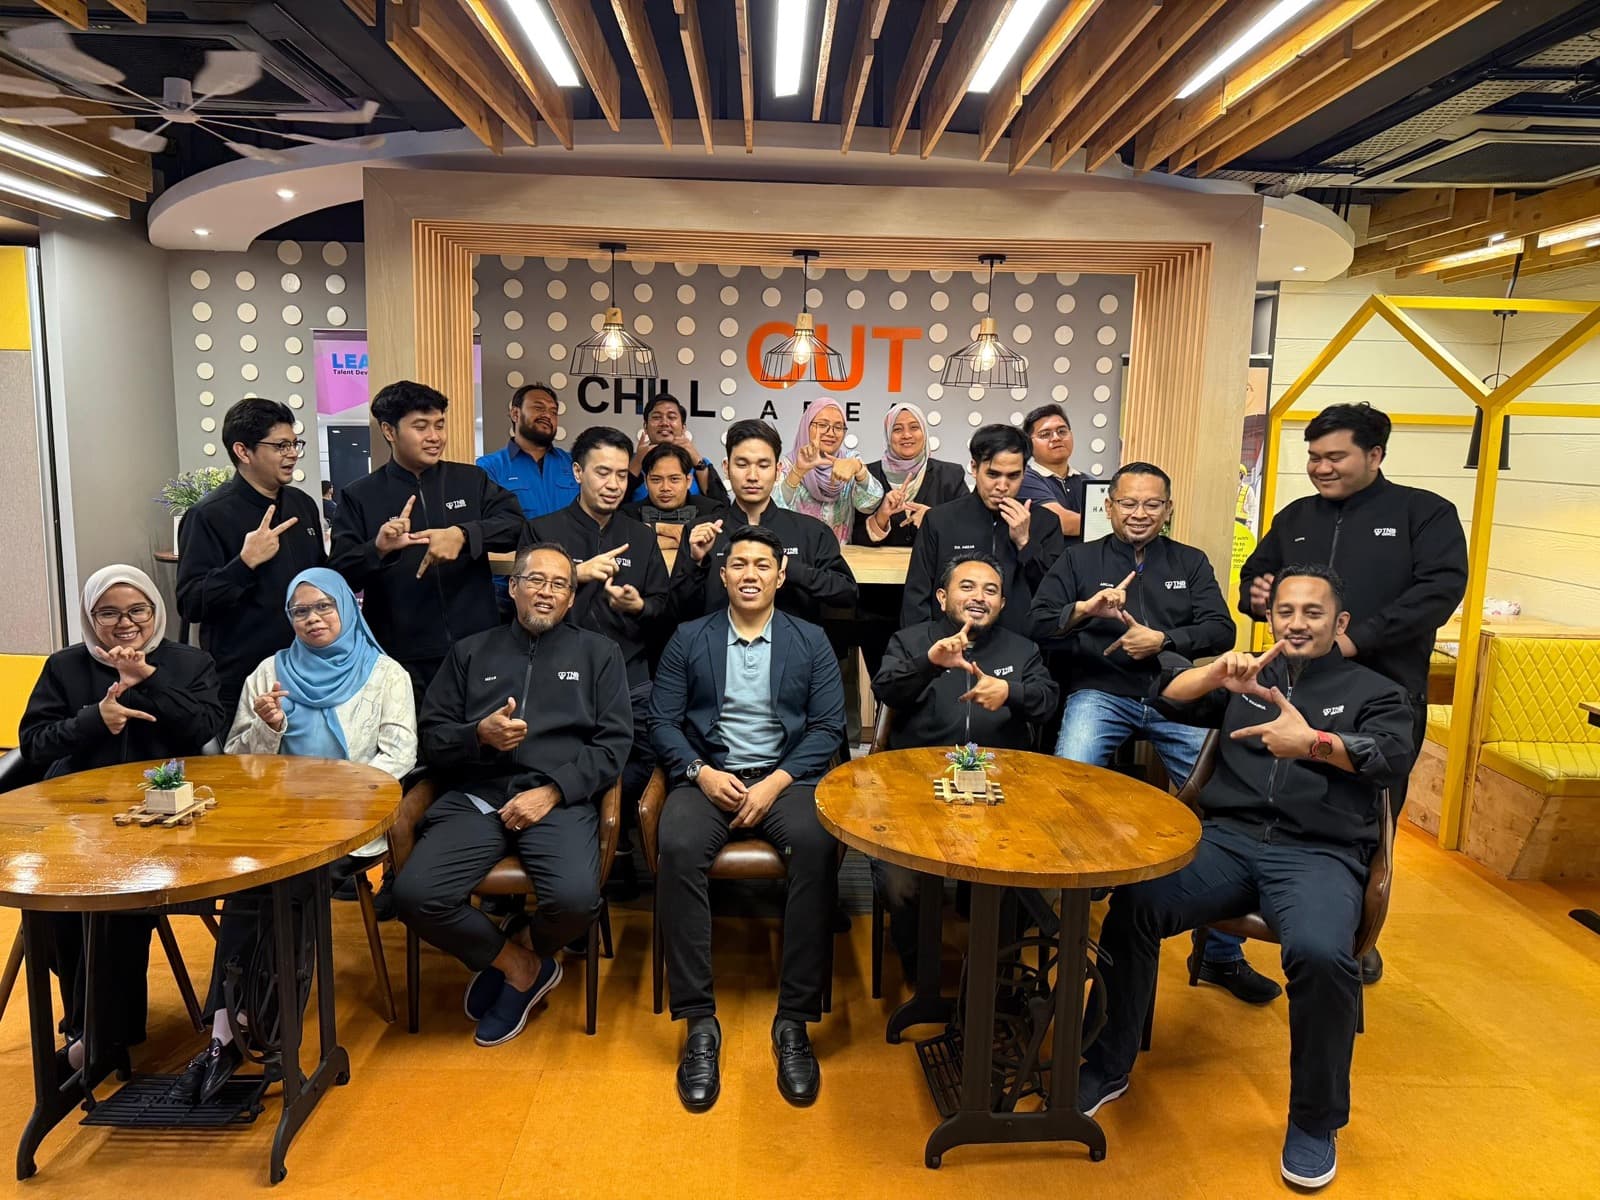 In-house corporate training
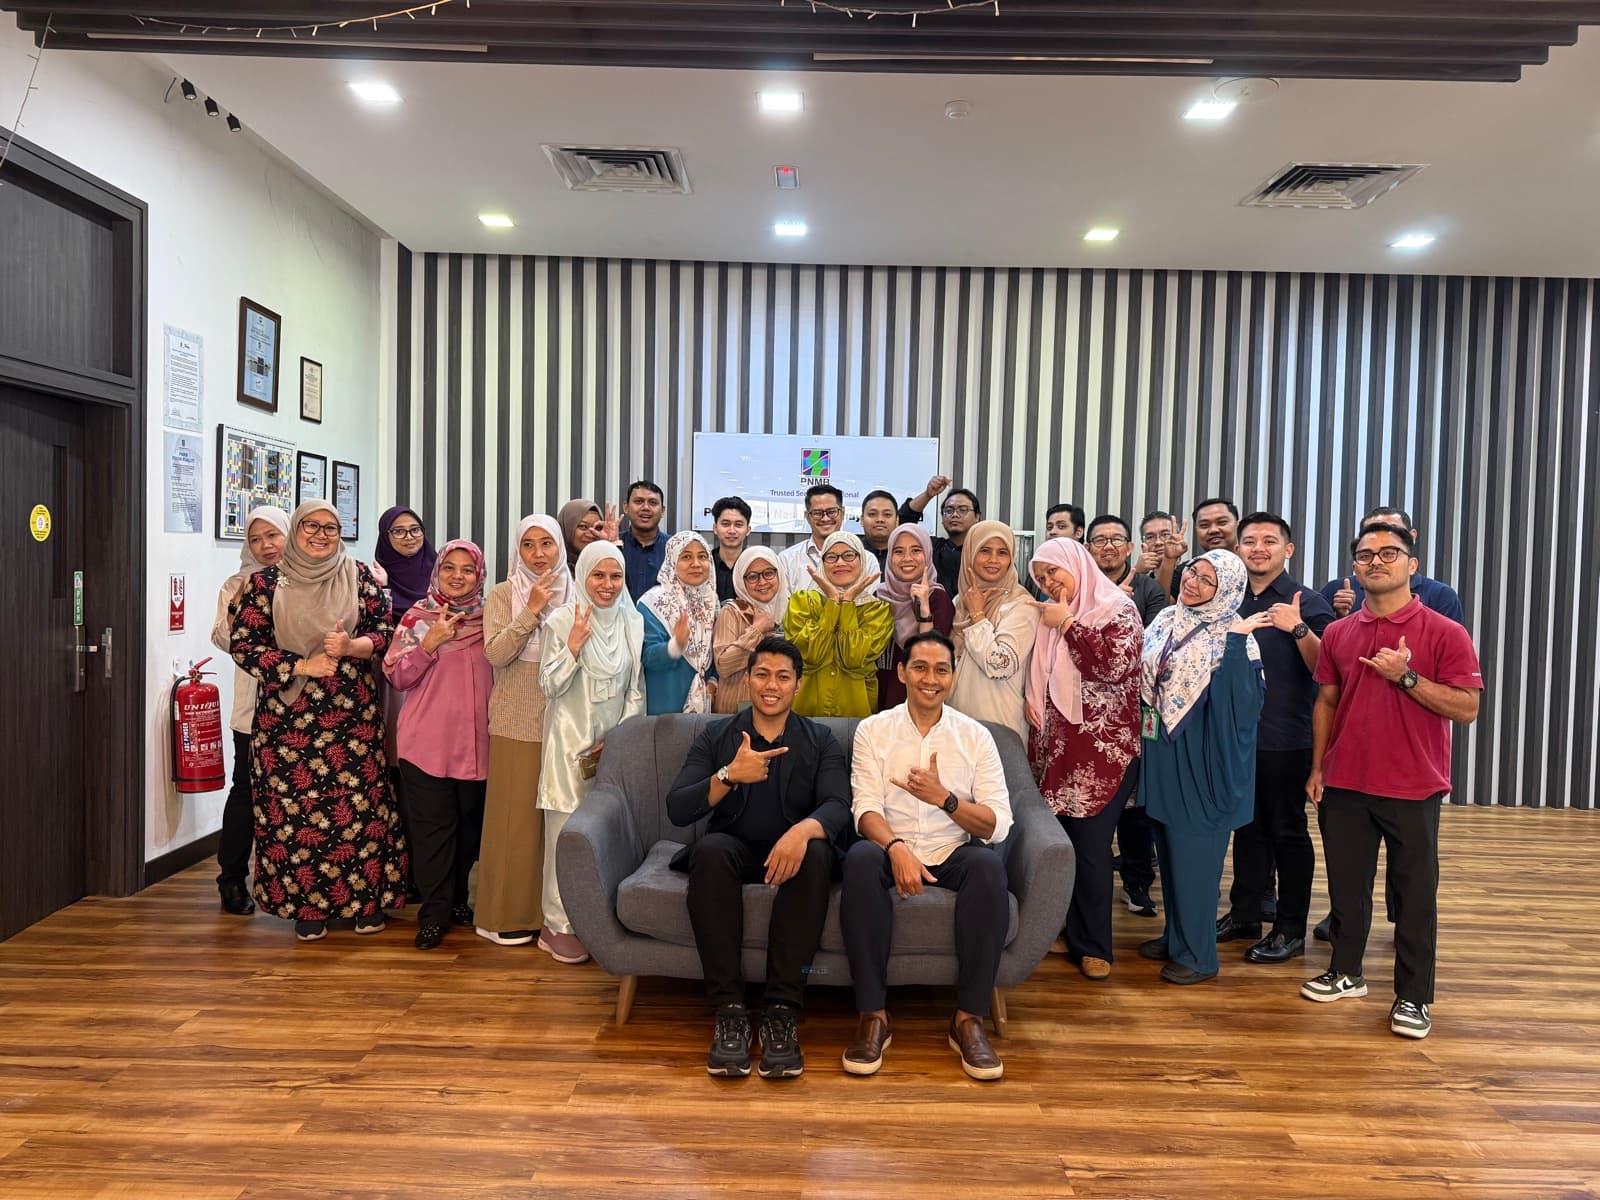 Corporate programme
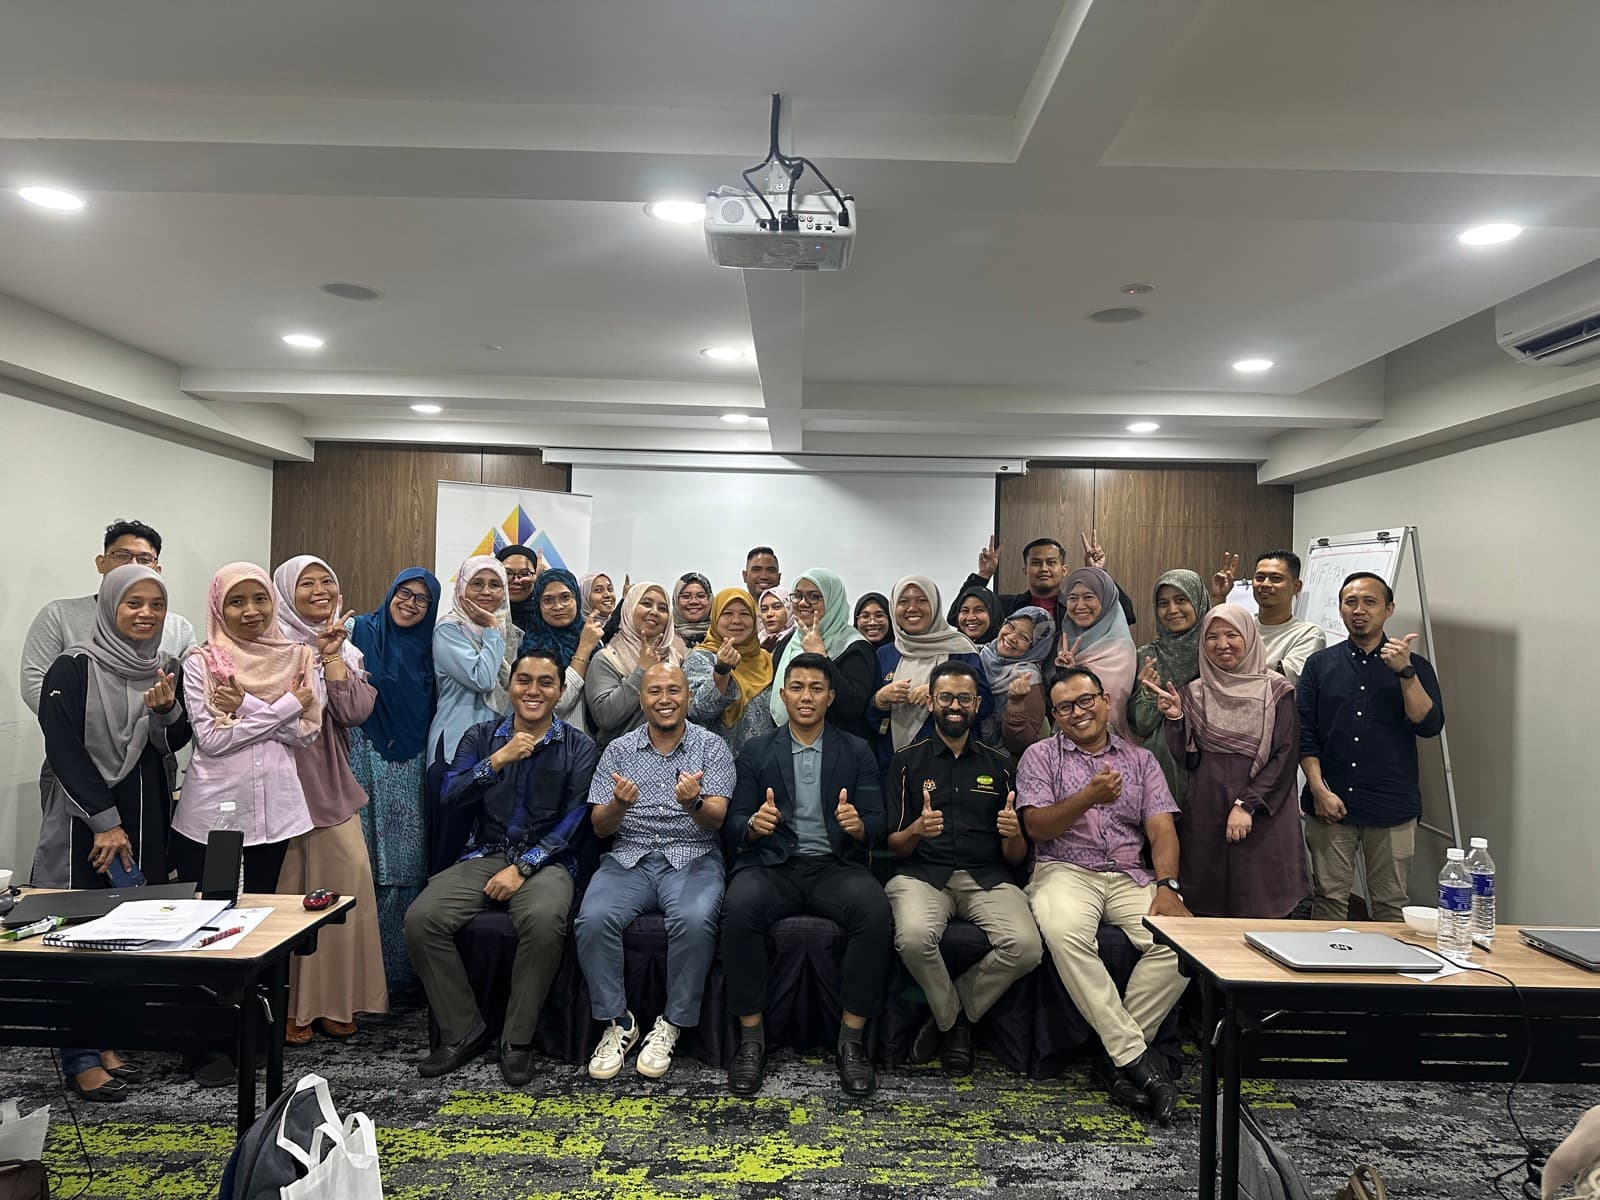 Public workshop
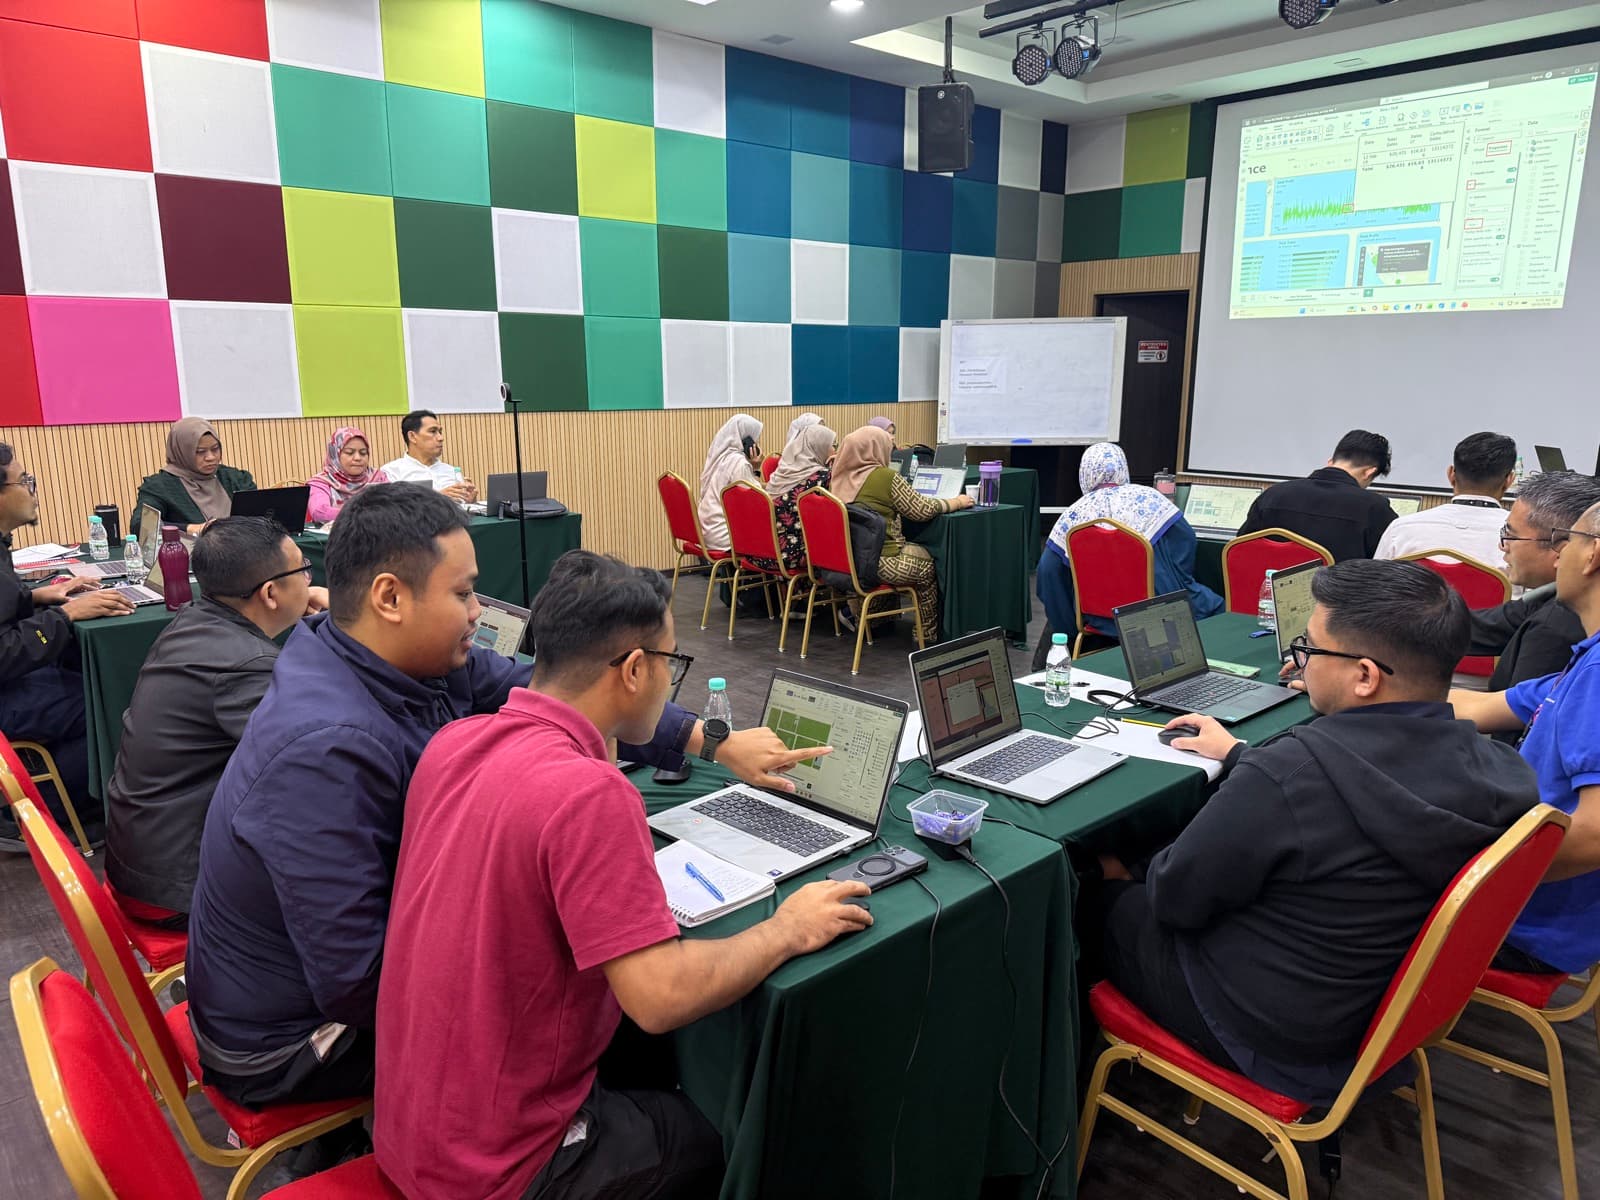 Hands-on classroom
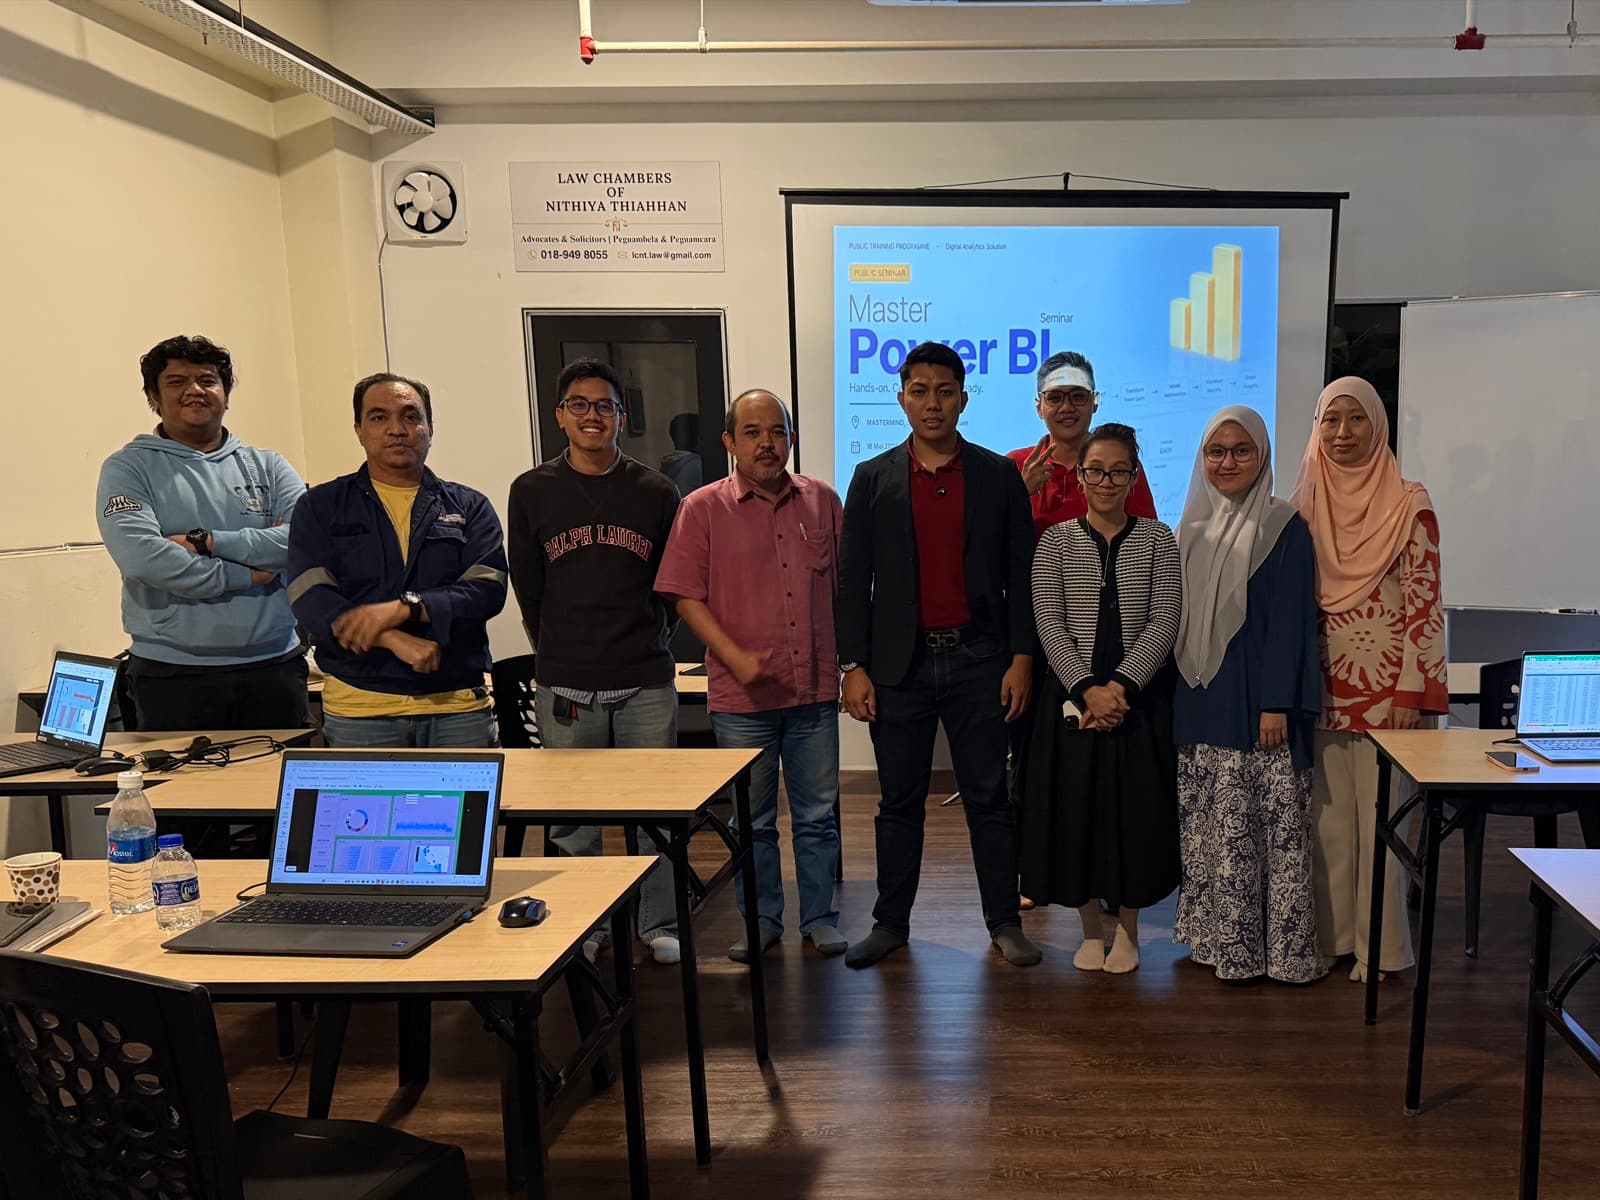 Classroom seminar
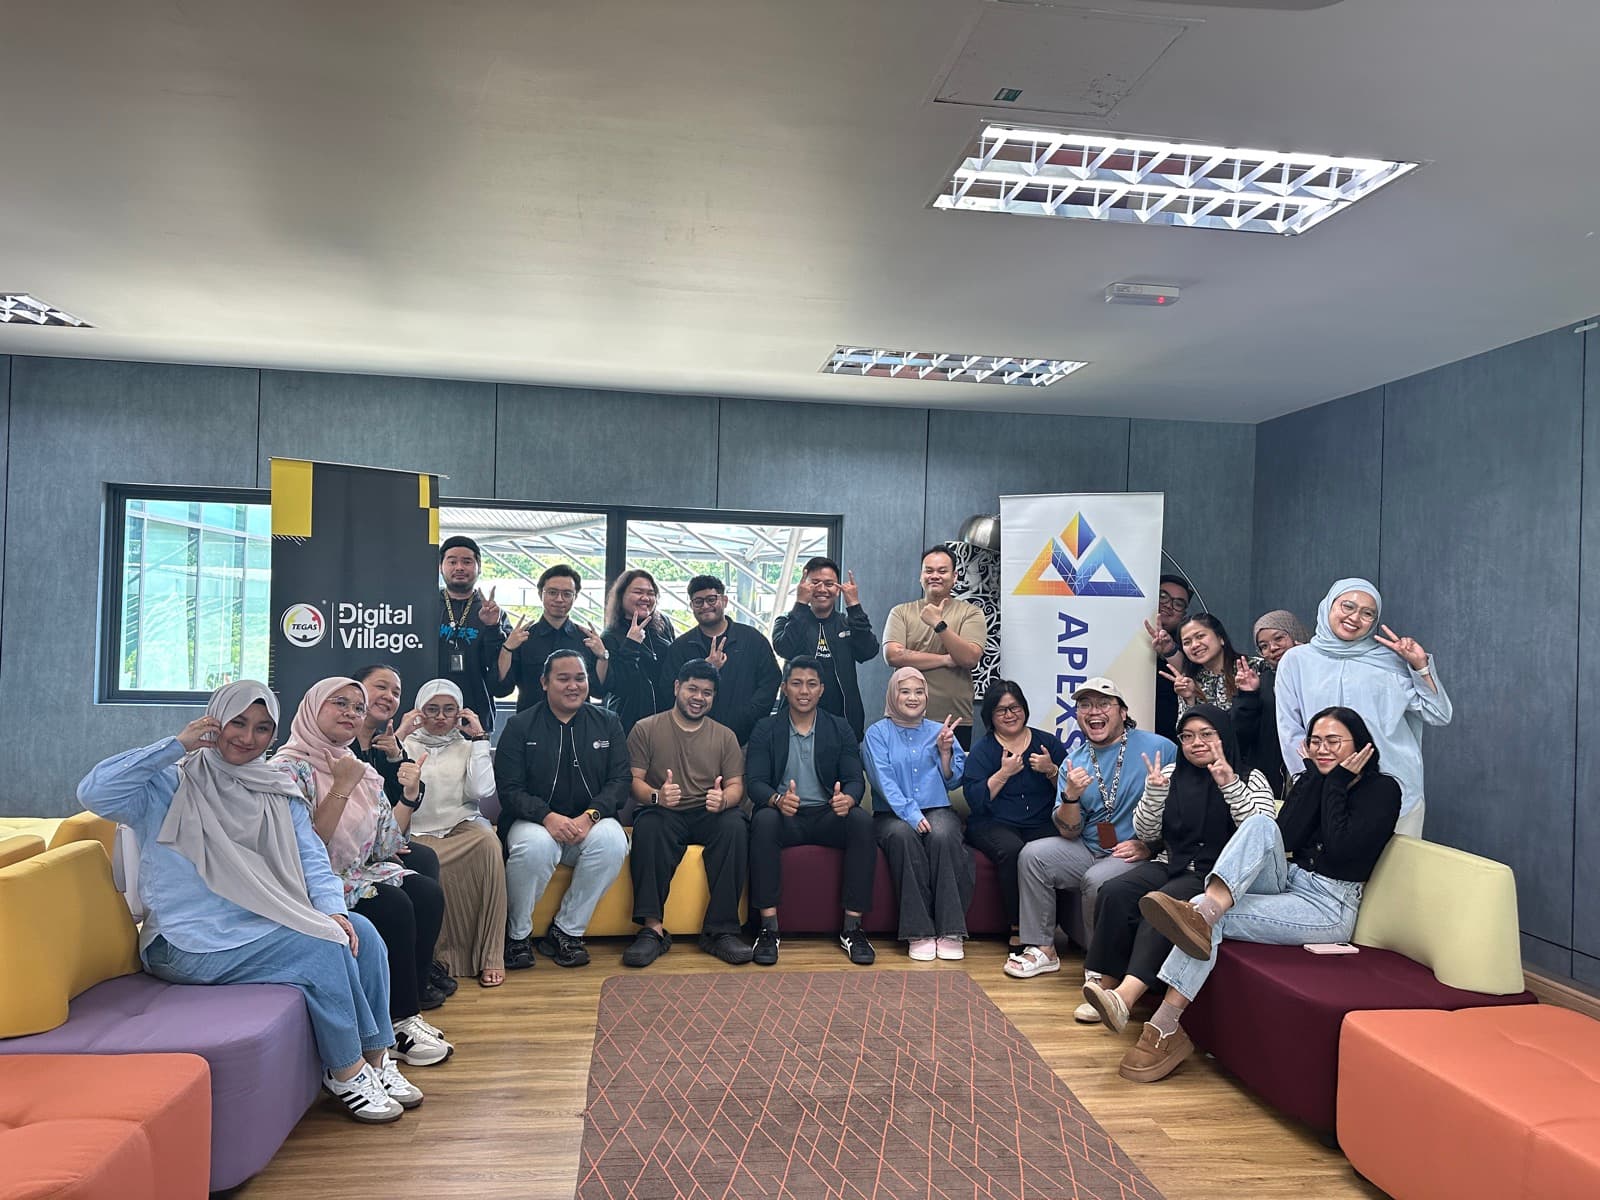 Community workshop
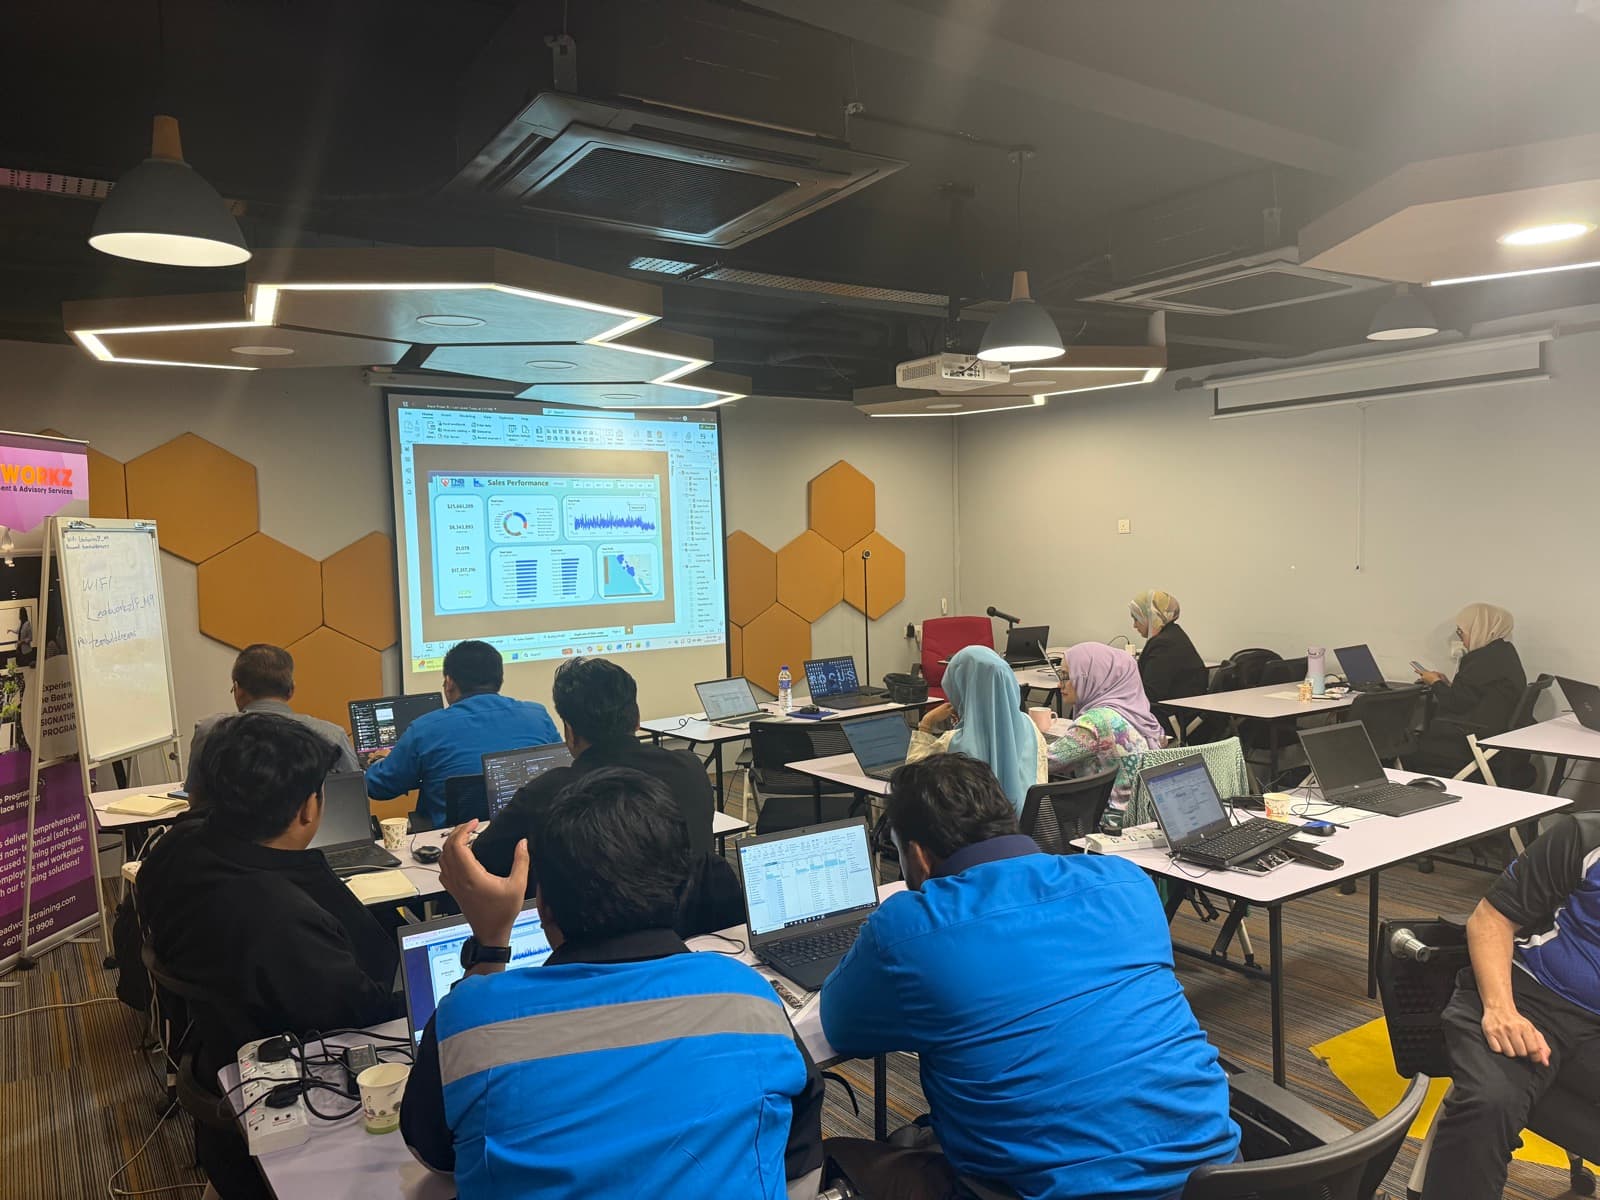 Guided practice
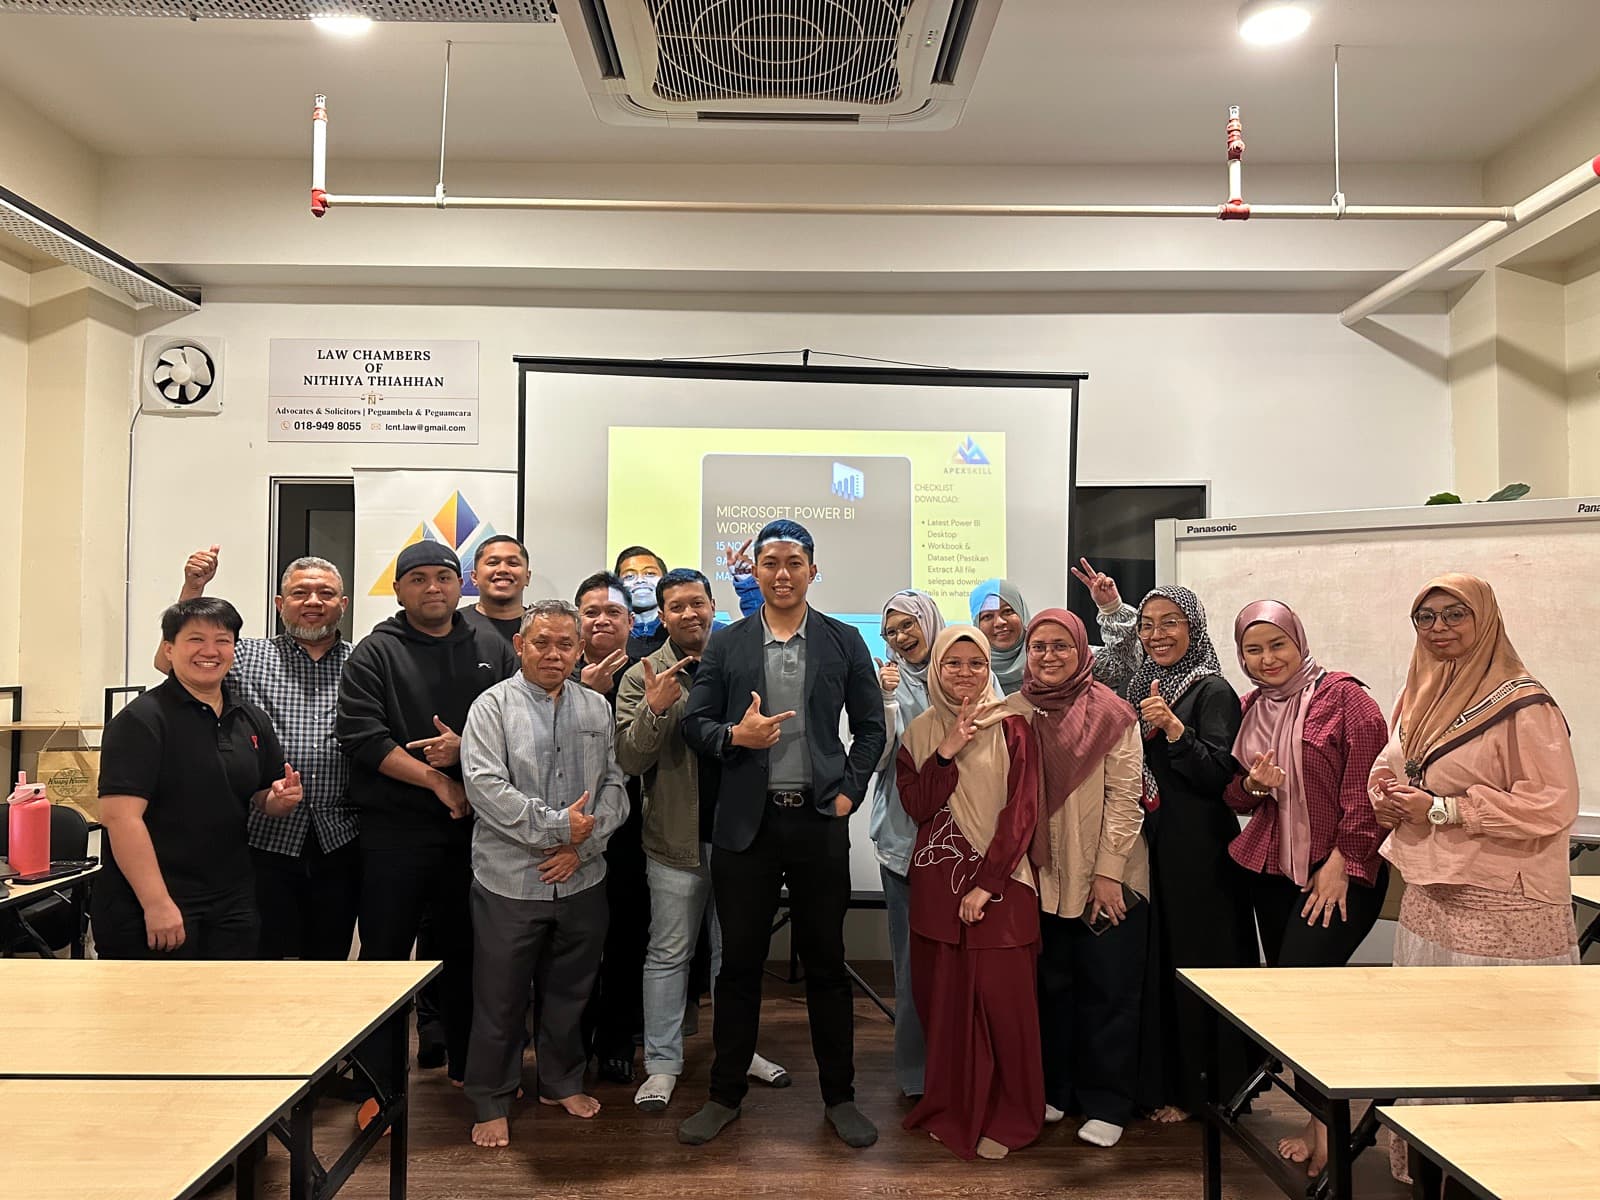 Power BI workshop
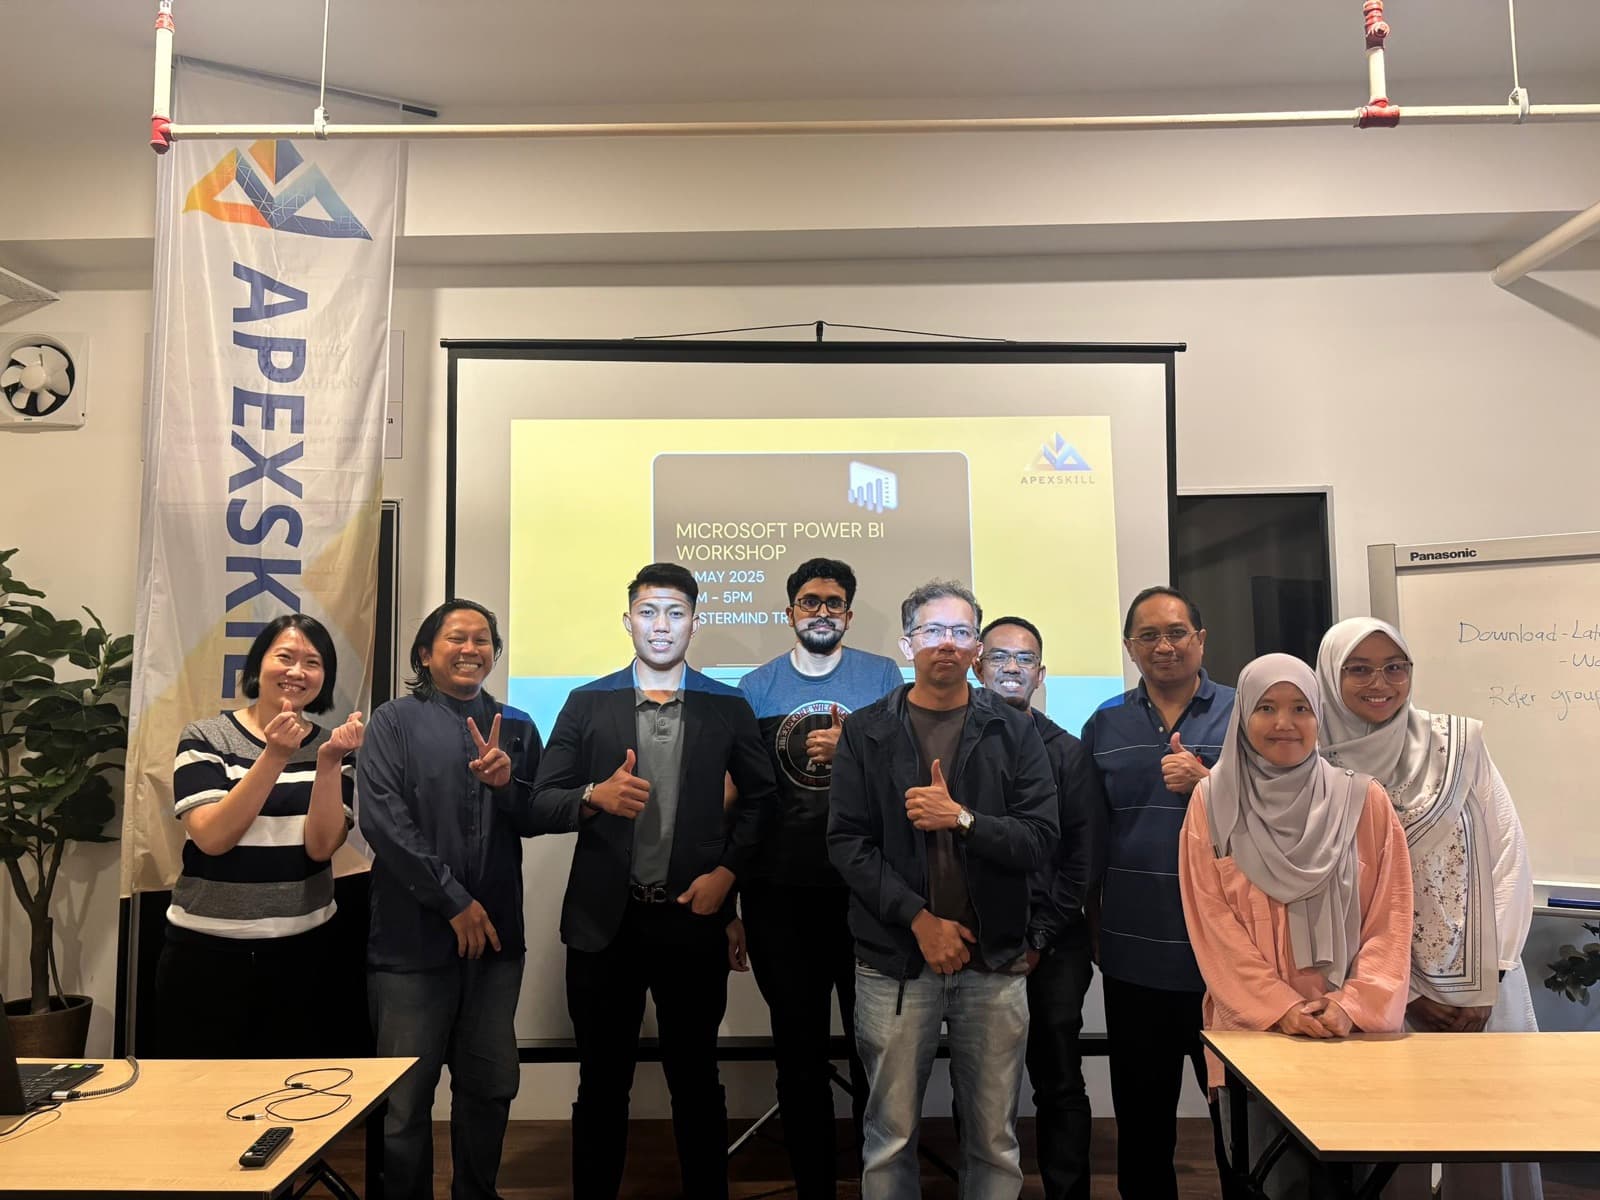 Microsoft Power BI workshop
/03 How we approach the work
Useful to the business. Understandable to the team.
- 01
Start with the question
Define the decision or workflow that needs improving before choosing the tool.
- 02
Involve the users
Build and review with the people who will depend on the output.
- 03
Teach what we practise
Share the delivery methods, trade-offs and working examples teams need to understand.
- 04
Prepare for ownership
Make the documentation, operating process and responsibilities clear at handover.
Let’s work together
What does your team need to do better?
Tell us about the current process and the result you need. We will help you define a practical next step.