
Introduction to DAX for Power BI: Formulas That Transform Your Reports
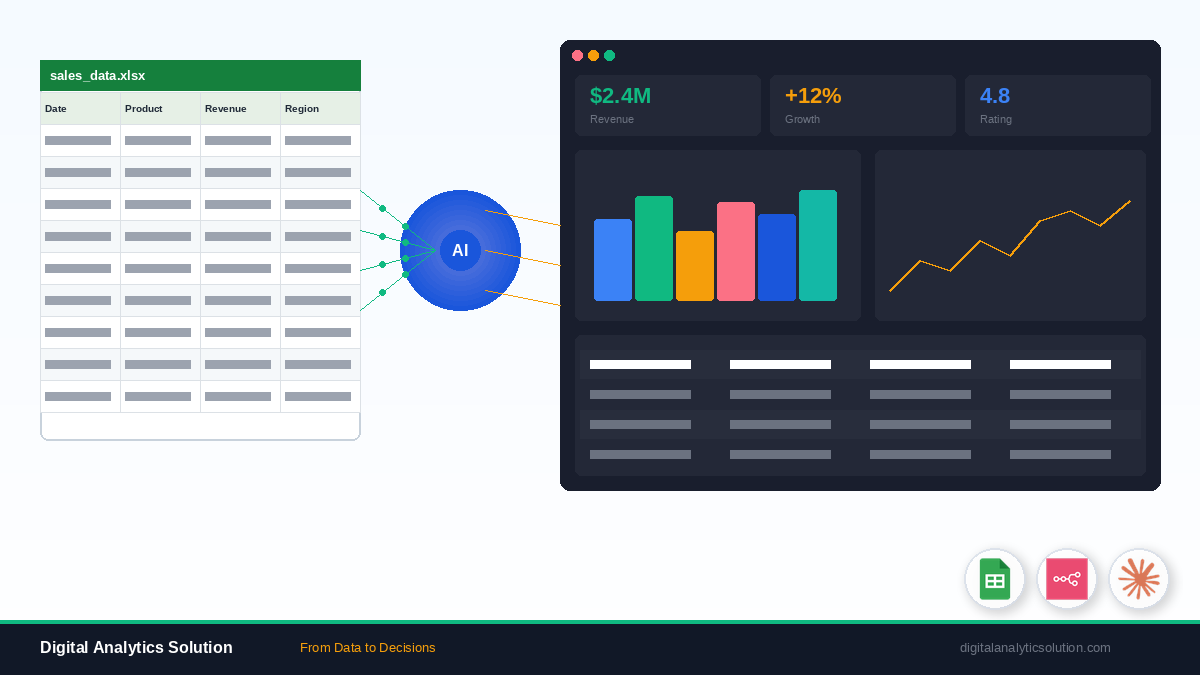
You have built a Power BI dashboard with clean data and attractive visuals. Then your manager asks: "What is the year-over-year growth rate?" or "Show me the running total" or "What percentage does each region contribute to total revenue?"
These questions cannot be answered with simple drag-and-drop. You need DAX.
DAX (Data Analysis Expressions) is the formula language of Power BI. It lets you create calculations that respond dynamically to user interactions. When someone clicks a filter or selects a date range, your DAX formulas recalculate instantly to reflect the new context.
This guide covers the essential DAX concepts every Power BI beginner needs.
DAX Basics: Calculated Columns vs Measures
Before writing any formula, you need to understand the two types of DAX calculations:
Calculated Columns are computed row by row and stored in your data model. They behave like adding a new column to your table. Use them when you need a value that depends on data within the same row.
Profit = Sales[Revenue] - Sales[Cost]
This formula runs once for every row in the Sales table and stores the result.
Measures are computed on the fly based on the current filter context. They do not add rows to your table. They calculate a result whenever a visual needs it.
Total Revenue = SUM(Sales[Revenue])
This formula calculates a different result depending on which filters are active. If a user filters by "Kuala Lumpur", the measure returns only Kuala Lumpur's revenue.
The rule of thumb: Use measures for aggregations (sums, averages, counts, percentages). Use calculated columns when you need to filter or sort by the calculated value.
Your First DAX Measures
Start with these five essential measures. They cover 80% of what most reports need.
1. SUM, AVERAGE, COUNT
The simplest DAX measures aggregate a single column:
Total Revenue = SUM(Sales[Revenue])
Average Order Value = AVERAGE(Sales[Revenue])
Total Orders = COUNTROWS(Sales)
These look straightforward, but their power comes from filter context. The same Total Revenue measure shows different values on different visuals depending on what is being filtered.
2. DISTINCTCOUNT
Count unique values instead of total rows:
Unique Customers = DISTINCTCOUNT(Sales[CustomerID])
This tells you how many different customers made purchases, not how many total transactions occurred.
3. DIVIDE (Safe Division)
Never use the / operator directly. If the denominator is zero, your report shows an error. Use DIVIDE instead:
Profit Margin = DIVIDE(SUM(Sales[Profit]), SUM(Sales[Revenue]), 0)
The third argument (0) is the fallback value when division by zero occurs.
4. IF (Conditional Logic)
Add logic to your measures:
Revenue Category =
IF(
    SUM(Sales[Revenue]) > 100000,
    "High",
    IF(SUM(Sales[Revenue]) > 50000, "Medium", "Low")
)
5. FORMAT (Display Formatting)
Control how your measures display:
Revenue Display = FORMAT(SUM(Sales[Revenue]), "RM #,##0")
Note: FORMAT returns text, not a number. Use it only for display purposes, never for calculations.
Understanding Filter Context
Filter context is the single most important concept in DAX. Every DAX measure evaluates within a context defined by:
Visual filters: what rows the current visual represents (e.g., a bar in a bar chart)
Page filters: filters applied to the entire page
Report filters: filters applied across all pages
Slicer selections: what the user has selected
Cross-filtering: clicks on other visuals
When you write Total Revenue = SUM(Sales[Revenue]), the result changes depending on all these filters combined.
For example, if your bar chart shows revenue by region:
The "Kuala Lumpur" bar evaluates
SUM(Sales[Revenue])where Region = "Kuala Lumpur"The "Penang" bar evaluates the same formula where Region = "Penang"
A card visual with no regional filter evaluates it across all regions
You wrote one formula. Power BI applies it in different contexts.
CALCULATE: The Most Powerful DAX Function
CALCULATE modifies filter context. It takes a measure and applies additional filters or removes existing ones.
CALCULATE(<expression>, <filter1>, <filter2>, ...)
Example 1: Revenue for a Specific Region
KL Revenue = CALCULATE(SUM(Sales[Revenue]), Sales[Region] = "Kuala Lumpur")
This always returns Kuala Lumpur's revenue, regardless of what the user filters. The CALCULATE function overrides the visual's filter context for the Region column.
Example 2: Percentage of Total
Revenue % of Total =
DIVIDE(
    SUM(Sales[Revenue]),
    CALCULATE(SUM(Sales[Revenue]), ALL(Sales[Region]))
)
ALL(Sales[Region]) removes the region filter, so the denominator always returns total revenue across all regions. The numerator respects the current filter context. The result is each region's percentage contribution.
Example 3: Year-to-Date Revenue
YTD Revenue = TOTALYTD(SUM(Sales[Revenue]), 'Date'[Date])
TOTALYTD is a time intelligence shortcut built on CALCULATE. It filters the date table from the start of the year up to the current date in context.
Time Intelligence Functions
Time intelligence is where DAX truly shines. These functions require a proper date table in your model.
Creating a Date Table:
Date = CALENDAR(DATE(2024, 1, 1), DATE(2026, 12, 31))
Add calculated columns for Year, Month, Quarter, and Day, then mark the table as a Date Table in Power BI (Table Tools > Mark as Date Table).
Essential Time Intelligence Measures
Previous Period Comparison:
Last Year Revenue = CALCULATE(SUM(Sales[Revenue]), SAMEPERIODLASTYEAR('Date'[Date]))
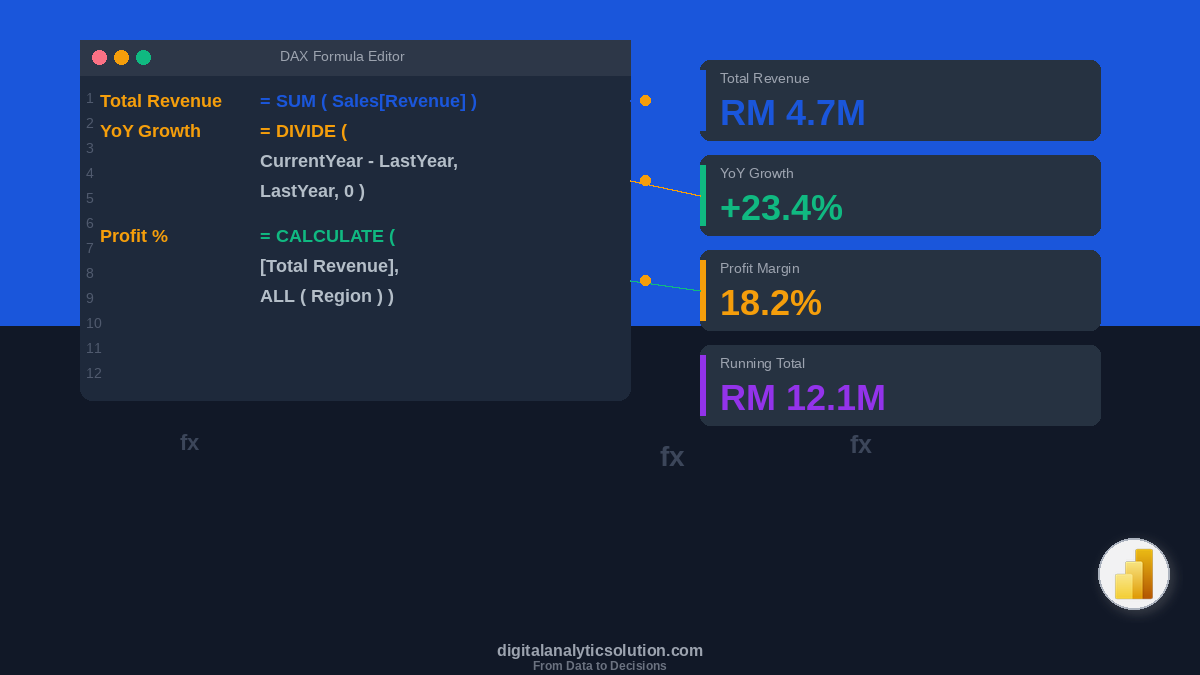
Year-Over-Year Growth:
YoY Growth =
VAR CurrentYear = SUM(Sales[Revenue])
VAR LastYear = CALCULATE(SUM(Sales[Revenue]), SAMEPERIODLASTYEAR('Date'[Date]))
RETURN
DIVIDE(CurrentYear - LastYear, LastYear, 0)
Running Total:
Running Total =
CALCULATE(
    SUM(Sales[Revenue]),
    FILTER(
        ALL('Date'[Date]),
        'Date'[Date] <= MAX('Date'[Date])
    )
)
Moving Average (3-Month):
3M Moving Avg =
AVERAGEX(
    DATESINPERIOD('Date'[Date], MAX('Date'[Date]), -3, MONTH),
    CALCULATE(SUM(Sales[Revenue]))
)
Variables: Write Cleaner DAX
Variables make complex DAX readable and efficient. Define a value once with VAR, then reference it with RETURN:
Revenue vs Target =
VAR Actual = SUM(Sales[Revenue])
VAR Target = SUM(Targets[TargetRevenue])
VAR Difference = Actual - Target
VAR PercentAchieved = DIVIDE(Actual, Target, 0)
RETURN
    IF(PercentAchieved >= 1, "On Track", "Behind by RM " & FORMAT(ABS(Difference), "#,##0"))
Variables are evaluated once and reused, which also improves performance compared to repeating the same sub-expression.
Common DAX Mistakes
Confusing calculated columns with measures. If you put a SUM in a calculated column, it sums the entire table for every row, which is almost never what you want. Aggregations belong in measures.
Ignoring filter context. If your measure returns the same number regardless of filters, you probably used ALL somewhere without realising it removes necessary context.
Not creating a proper date table. Time intelligence functions fail without a contiguous date table with no gaps. Auto-generated date hierarchies are not sufficient for advanced calculations.
Overcomplicating formulas. Before writing a 10-line DAX formula, check if Power Query can handle the transformation instead. Move data preparation upstream whenever possible.
What to Learn Next
DAX is a deep topic, but these fundamentals cover most reporting scenarios. Continue building your Power BI skills:
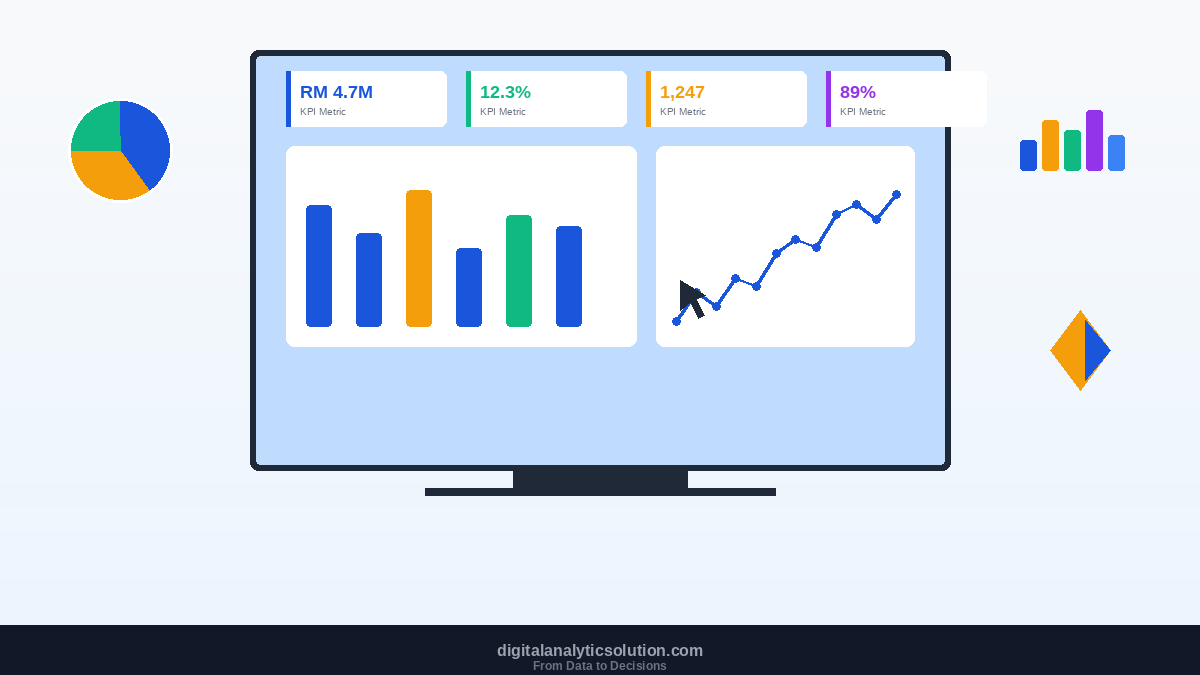
Dashboard Design Principles: present your DAX-powered insights in clear, effective layouts
Data Storytelling: turn calculated measures into narratives that influence decisions
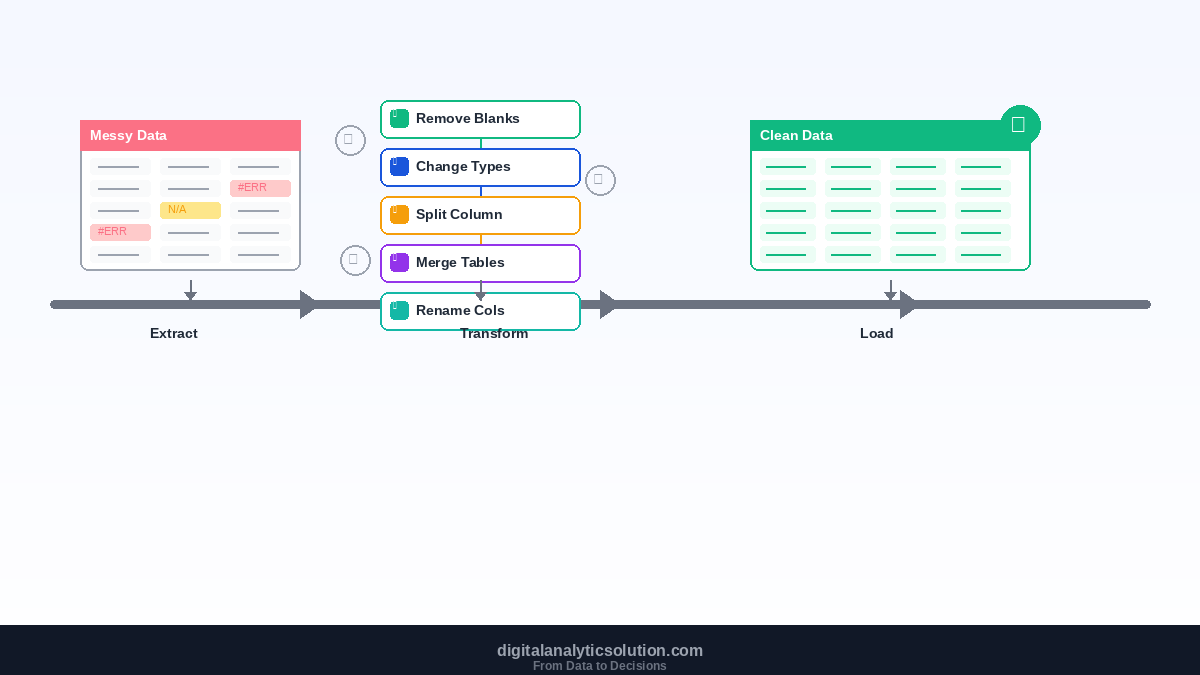
Getting Started with Power BI: if you need a refresher on the basics
Power Query for Data Cleaning: prepare your data properly before DAX calculations
You can also explore data analysis with Claude Code for complementary analytical techniques, or learn how to build data pipelines with n8n to automate the data feeding into your Power BI models.
Summary
DAX transforms Power BI from a charting tool into a calculation engine. Measures give you dynamic aggregations that respond to user interaction. CALCULATE lets you override filter context for comparisons and percentages. Time intelligence functions handle period-over-period analysis with minimal code.
Start with the five essential measures. Understand filter context. Use CALCULATE deliberately. Everything else builds on these foundations.
This article is part of the Digital Analytics Solution content series. Explore the full series to build your skills in automation, AI-assisted development, and data analytics.