
Data Analysis Made Easy: Using Claude Code for Instant Insights
Data analysis used to require a data science degree, proficiency in Python or R, and hours of wrangling messy datasets. Not anymore. With Claude Code, Anthropic's AI-powered coding assistant, you can analyze data, create visualizations, and extract insights simply by describing what you want in plain English.
This guide shows you how to leverage Claude Code for practical data analysis tasks — from simple CSV exploration to advanced statistical analysis and chart generation.
What is Claude Code?
Claude Code is Anthropic's command-line tool for agentic coding. It gives you direct access to Claude's intelligence in your terminal, where it can read files, write code, execute scripts, and iterate on results — all from natural language instructions.
For data analysis, this means you can say things like:
"Analyze this CSV and tell me the top 10 customers by revenue"
"Create a bar chart showing monthly sales trends"
"Find correlations between marketing spend and conversion rates"
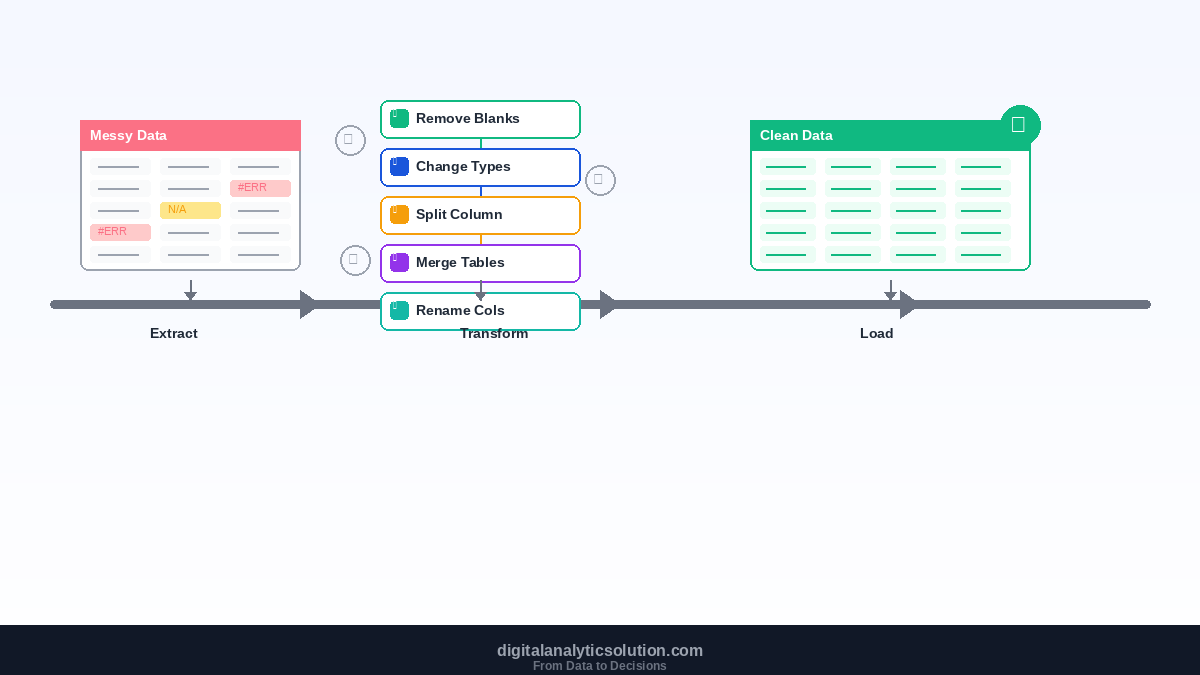
"Clean this dataset — remove duplicates, fix date formats, and fill missing values"
Claude Code writes the Python code, executes it, and shows you the results. No copy-pasting between ChatGPT and your terminal.
Getting Started: Your First Data Analysis with Claude Code
Step 1: Install Claude Code
npm install -g @anthropic-ai/claude-code
Step 2: Navigate to Your Data
cd ~/projects/my-data
claude
Step 3: Ask Claude to Analyze
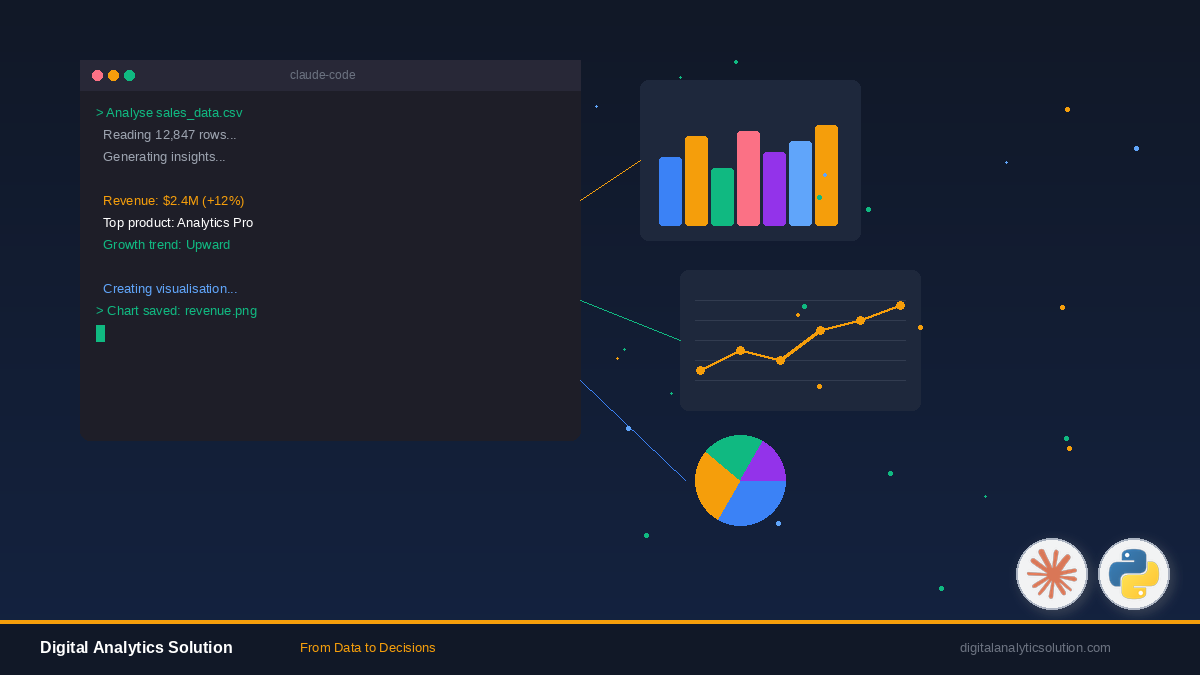
Once inside the Claude Code session, simply describe your analysis:
> Analyze sales_data.csv. Show me total revenue by month,
  identify the top 5 products, and create a visualization.
Claude Code will:
Read and parse the CSV file
Write Python code using pandas and matplotlib
Execute the analysis
Display results and save charts to your project folder
Practical Data Analysis Workflows
Workflow 1: Exploratory Data Analysis (EDA)
Start any analysis by understanding your data. Ask Claude Code:
> Give me a complete overview of dataset.csv —
  shape, column types, missing values, basic statistics,
  and distribution of key numeric columns.
Claude Code will generate a comprehensive EDA report including data shape, descriptive statistics, null value counts, and distribution histograms.
Workflow 2: Sales and Revenue Analysis
> Using quarterly_sales.csv, calculate:
  - Total revenue per quarter
  - Quarter-over-quarter growth rate
  - Best performing product category
  - Revenue forecast for next quarter using linear regression
  Create charts for each metric.
This single prompt produces a multi-faceted analysis that would traditionally take a data analyst hours to code manually.
Workflow 3: Customer Segmentation
> Analyze customer_data.csv and segment customers using
  RFM analysis (Recency, Frequency, Monetary).
  Create a scatter plot of the segments and
  recommend marketing strategies for each group.
Claude Code will implement K-means clustering, create visual segments, and even provide strategic recommendations based on the data patterns.
Workflow 4: Survey Data Analysis
> Process survey_responses.csv:
  - Calculate response rates per question
  - Generate sentiment distribution charts
  - Cross-tabulate responses by demographic groups
  - Identify statistically significant differences
  Export the results to a formatted Excel file.
Why Claude Code Excels at Data Analysis
Natural Language Interface
You don't need to remember pandas syntax, matplotlib parameters, or scipy functions. Describe what you want, and Claude Code handles the implementation.
Iterative Refinement
Don't like the chart colors? Want to filter outliers? Just tell Claude Code:
> Make the chart use a dark theme, remove outliers
  beyond 3 standard deviations, and add trend lines.
It modifies the code and re-runs the analysis instantly.
Context Awareness
Claude Code remembers your entire session. You can build on previous analyses:
> Now take the top 5 products from the earlier analysis
  and show me their weekly sales pattern over the last 6 months.
Code You Can Keep
Every piece of code Claude Code writes is saved in your project. You get a reusable analysis pipeline, not just a one-time answer.
Advanced Techniques
Connecting to Databases
> Connect to the PostgreSQL database at localhost:5432/analytics,
  query the last 30 days of user activity,
  and create a cohort retention analysis.
Working with APIs
> Fetch the last 90 days of Google Analytics data
  using the GA4 API, analyze traffic sources,
  and identify which channels have the highest conversion rate.
Combining Multiple Data Sources
> Join sales_data.csv with marketing_spend.csv on the date column,
  then calculate the ROI for each marketing channel
  and visualize it as a waterfall chart.
Claude Code vs. Traditional Data Analysis Tools
Feature | Claude Code | Jupyter Notebooks | Excel |
|---|---|---|---|
Learning curve | Minimal | Moderate | Low |
Complex analysis | Excellent | Excellent | Limited |
Visualization | Automated | Manual coding | Basic |
Reproducibility | Full code saved | Full code saved | Formula-based |
Natural language | Yes | No | No |
Large datasets | Handles well | Handles well | Struggles |
AI-powered insights | Built-in | Requires setup | No |
Integrating Data Analysis with Your Automation Stack
Data analysis becomes even more powerful when integrated with automation. For example:
Use n8n to automatically pull data from Google Sheets, analyze it with Claude Code, and email the results
Build a data pipeline with n8n that feeds clean data into your analysis workflow
Combine analysis with vibes coding to rapidly build dashboards from your insights
Getting the Most Out of Claude Code for Data Analysis
Here are some tips to maximize your productivity:
Be specific about output format — Tell Claude Code if you want charts, tables, CSV exports, or all three
Provide context — Mention what the data represents so Claude Code can make relevant recommendations
Ask for validation — Request statistical significance tests, confidence intervals, or cross-validation
Iterate freely — Each follow-up prompt refines the analysis further
Save your workflows — Ask Claude Code to create a reusable script from your analysis session
Want to see how Claude Code compares to traditional development? Read Claude Code vs Traditional Coding: Why AI-Assisted Development Wins.